Journal of Financial Planning: August 2015
Wade D. Pfau, Ph.D., CFA, is a professor of retirement income at The American College and the 2012 and the 2014 recipient of the Journal’s Montgomery-Warschauer Award. He hosts the Retirement Researcher blog at www.retirementresearcher.com.
The Trinity Study, which was first published in 1998 and most recently updated in the Journal in April 2011 (“Portfolio Success Rates: Where to Draw the Line”), is one of the hallmark studies in retirement income planning. I will update the study with data through the end of 2014, but then explain how this study is widely misinterpreted and can be modified to better reflect the reality meeting today’s retiring clients.
The Trinity study followed the same methodology William Bengen used in his 1994 Journal article that led to the 4 percent rule. The difference was that rather than focusing on Bengen’s SAFEMAX, or the highest sustainable withdrawal rate possible in the worst-case scenario from rolling periods in the historical data, the Trinity authors changed the focus to “portfolio success rates."
By mixing the S&P 500 with long-term corporate bonds, the Trinity study calculated that a 4 percent initial spending rate, with subsequent spending adjusting upwards for inflation, would have survived in 95 percent of the historical rolling 30-year periods when using a 50/50 portfolio. Bengen had found that 4 percent always worked, and the difference is that he used intermediate-term government bonds to represent the bond market. With the switch to more volatile corporate bonds, new retirees in 1965 and 1966 would have just missed being able to sustain a 4 percent spending rate for 30 years.
Unfortunately, 95 percent confidence is a widely used term in statistics, and I fear that this led to people misinterpreting the Trinity study conclusion about the 4 percent rule having a 95 percent chance for success. It succeeded in 95 percent of the rolling historical 30-year periods, but it doesn’t follow that new retirees today will necessarily enjoy a 95 percent chance that the 4 percent rule will work for them. More on this in a moment.
Trinity Study Updated with Historical Data
Table 1 updates the Trinity study using data through 2014, and I’ve switched to Bengen’s approach of using intermediate-term government bonds. In terms of the return/volatility tradeoff, these sorts of bonds tend to provide the best outcomes in studies about sustainable retirement spending.
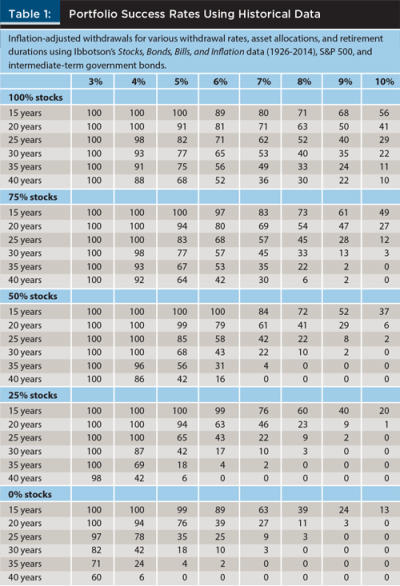
The table shows the historical portfolio success rates for different withdrawal rates (3 to 10 percent), for different time horizons (15 to 40 years), and for different asset allocations (100 to 0 percent stocks).
For instance, what is the success rate for a 5 percent inflation-adjusted withdrawal rate over a 30-year period with a 50/50 asset allocation? To answer, note that there are 60 rolling 30-year periods starting between 1926 and 2014. These rolling 30-year periods begin in the years 1926 through 1985. We cannot yet determine the 30-year results for more recent starting periods. Of these 60 rolling periods, we can count up the number of times that the historical surviving withdrawal rate was at least as high as 5 percent. The answer is 41 times; that means the portfolio success rate is 100 x 41 / 60 = 68 percent.
The same calculation procedure is used for all the combinations shown in the table. We can generally observe that success rates increase for lower withdrawal rates, shorter time horizons, and higher stock allocations. We can also see how sensitive results are to withdrawal rates. For instance, with 30-year horizons and a 50/50 portfolio, the success rate is 100 percent with a 4 percent initial withdrawal rate, and it falls to 68 percent with a 5 percent withdrawal rate, and only 43 percent with a 6 percent withdrawal rate. Also note that clients are living longer these days, and the success rate for the 4 percent rule falls from 100 percent to 86 percent even in the historical data with a 50/50 portfolio when the retirement horizon extends from 30 years to 40 years.
A More Realistic Table for Today’s Retirees
Conventional wisdom maintains that the success rates shown in the Trinity
study can be reasonably used to reflect the outlook for new retirements beginning today. The argument is that the historical record since 1926 has seen a variety of market environments including the Great Depression, the stagnation in the 1970s, and so on. The Trinity study tables already reflect really bad market environments, and so it is reasonable to build a retirement income strategy based on these past historical results.
This, however, misses a very important point. It is not the past historical outcomes that matter for today’s retirees, but where markets are today. Sustainable spending rates are tied closely to the underlying market returns, and with sequence of returns risk, the market returns experienced early in retirement have a disproportionate impact on the final outcomes. For today’s retirees, the income from these broadly diversified investment portfolios will not be sufficient to meet a 4 percent withdrawal rate.
Historical withdrawal rates are not random; they tend to be lower when stock market valuations are high and when interest rates are low. Both of these factors are at work today in a way that has been rarely experienced in the historical record. For instance, on the interest rate side, there were only a few years in the 1940s when yields on intermediate-term government bonds were as low as they are today.
It will be necessary to sell principal in order to spend at 4 percent today, and this amplifies sequence of returns risk. It is a point I elaborated upon with David Blanchett and Michael Finke in our June 2013 Journal article that won the 2014 Montgomery-Warschauer award (“The 4 Percent Rule Is Not Safe in a Low-Yield World”). Even if interest rates go up later in one’s retirement, damage has already been done to the portfolio trying to maintain a 4 percent spending rate. The probability that the 4 percent rule can succeed for a new retirement today will be less than the probabilities shown in the Trinity study.
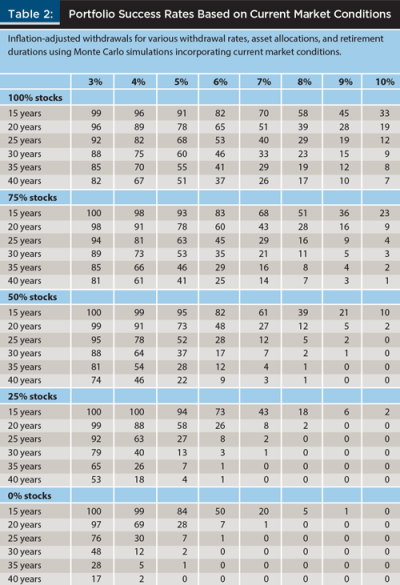
Table 2 shows updated estimates for the Trinity study success rates using Monte Carlo simulations that reflect interest rates that start off low at the start of the retirement period, but slowly increase on average over time toward their historical average. I match the premium that stocks earn above bonds to the historical data, and with the lower interest rates today it also means that it will take some time before the Monte Carlo simulations provide stock returns fluctuating around their historical averages. This is a more realistic assessment for new retirees.
Table 2 does not show the historical success rates for different strategies. Rather, it shows the odds for success for the spending strategies when calibrated to the market environment for clients entering retirement at the present.
These numbers are more sobering. I find, for instance, that the probability of success for a 4 percent initial spending rate over 30 years is 64 percent for a 50 percent stock allocation and 73 percent for a 75 percent stock allocation. It is not 95 or 100 percent.
Although it is not the case that a 4 percent spending rate will clearly fail, it will indeed be more of a challenge for investment portfolios to provide the income needed to make the 4 percent rule work. Clients are more vulnerable to a bad sequence. They will have to spend at rates above what the yield curve can support, and this amplifies sequence risk. It is important for advisers to maintain caution when recommending retirement income strategies based on historical data to their clients in today’s low-yield environment.