Journal of Financial Planning: April 2021
William P. Bengen received a bachelor’s from the Massachusetts Institute of Technology in aeronautics and astronautics. From 1989 through 2013, he operated a fee-only financial planning practice in El Cajon, Calif. In the early 1990s, in response to client questions, Bengen initiated research on the sustainability of withdrawals from stock and bond portfolios, which gave rise to the so-called “4 percent rule.”
JOIN THE DISCUSSION: Discuss this article with fellow FPA Members through FPA's Knowledge Circles.
FEEDBACK: If you have any questions or comments on this article, please contact the editor HERE.
NOTE: Click on the tables and figures below for PDF versions.
Since 1993, I’ve been researching sustainable withdrawals from retirement portfolios and searching for something: a complete, soup-to-nuts approach to managing the withdrawal process—from construction of the original withdrawal plan, through monitoring the plan and identifying deviations, to applying corrections, as needed. I present in this article my version of the financial planner’s complete toolkit for managing withdrawal plans. As with any area of financial planning, you can’t launch the initial plan and expect it to be appropriate for the client forever. A withdrawal plan needs to be actively managed to determine if the plan no longer suits a client’s needs, and to make appropriate changes to bring the plan back into focus.
In a way, this article is more of an overview rather than a complete delineation of the process. My approach relies heavily on graphical elements: dozens of charts are required as part of the toolkit. Furthermore, owing to the large number of variables involved, withdrawal planning is imbued with an inherent complexity. Accordingly, there simply isn’t room in an article of this length to provide you with the level of detail demanded for a full exposition of my methods. So, consider this a test drive and please wait for the production models to be released in the near future.
I’ll proceed in three steps:
- Establishing the withdrawal plan (determining, among other variables, the withdrawal scheme and initial withdrawal rate).
- Monitoring the plan for deviations.
- Making corrections to the plan, as required (or as desired by the client).
These three steps may be repeated several times during the life of the client’s plan.
Step One: Establishing the Withdrawal Plan
Establishing the client’s goals always comes first in any planning process. For the purpose of illustration, let’s assume that the client is satisfied with the following specifications, in approximate order of importance:
- Withdrawal scheme: Annual withdrawals will increase with CPI.
- Initial withdrawal rate: The client wishes to withdraw the maximum amount possible each year (hence, SAFEMAX, or the highest “safe” initial withdrawal rate is applicable).
- Duration: The plan will last for a minimum of 30 years and is for only one individual.
- Accounts: The plan will be for only one account, a tax-deferred account.
- Legacy: The investment account may be exhausted on the last day of the 30th year (i.e., no requirement for an inheritance).
- Asset allocation: This will be fixed at 35 percent U.S. large-cap stocks (LCS), 20 percent U.S. small-cap stocks (SCS), and 45 percent intermediate-term U.S. government bonds (ITGB). This is not necessarily the optimum allocation of bonds and equities for all retirement environments, but it is a reasonable compromise.
- Rebalancing: Portfolio will be rebalanced at optimum intervals (initial analysis will assume once per year)
- Withdrawal frequency: Withdrawals will be made once annually, at the end of each year.
- Investments: These will be made in passive funds, which track their indexes exactly.
Initial Withdrawal Rate. In the early stages of my research, I developed a chart that offered the client a choice of withdrawal rates, with a “probability of success” attached.
The probability of success was determined simply by dividing the number of portfolios that provided at least the desired withdrawal rate by the total number of portfolios in the database (currently, about 260). The client was encouraged to choose a “success rate” they could live with. In effect, it was like asking them to plan a picnic without a calendar or a weather forecast. It was not very elegant or refined, but it was a useful first step.
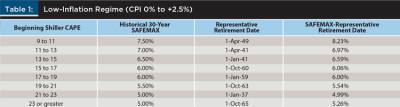
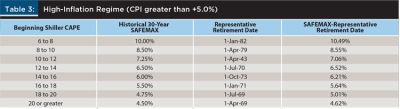
Recently, I developed a more sophisticated approach to the problem of the initial withdrawal rate (an enhancement of earlier research results by others, see the references section). It emerged from the recognition that historical withdrawal rates have a very high correlation (about 86 percent) with inflation and stock market valuations at the beginning of the plan. It led to the development of six tables, three of which are included here as Tables 1 through 3.
These tables identify a “safe” initial withdrawal rate (or “SAFEMAX,” as I term it), for various combinations of CPI (for the 12 months preceding plan initiation) and Shiller CAPE (at the time of plan initiation). Specified withdrawal rates are as low as 4.5 percent and as high as 13 percent, which covers the full range of withdrawal rates observed historically.
Let’s consider a specific example. Your client is retiring at a time when inflation is moderate—which I define as between 2.5 and 5 percent—with CAPE at 16.8. The applicable table for that inflation regime is found in Table 2. Referring to the line on the table applying to CAPE between 16 and 18, the recommended “SAFEMAX”—the maximum safe initial withdrawal rate—is 6 percent. This represents an approximate average of all the historical scenarios which match the above CPI and CAPE range.
Of course, the client does not have to choose the withdrawal rate specified in the tables. They may choose a rate somewhat lower if they desire to build a margin of error into their plan and reduce the risk of portfolio exhaustion at the end of 30 years.
Conversely, the client may wish to be more aggressive and choose a rate higher than specified, in hopes of living a better lifestyle. In that case, it would be important for the client to understand how much “risk of premature exhaustion” they are taking on.
In the tables, each of the withdrawal rates is linked to a “representative retirement” scenario (columns 3 and 4). The scenarios in column 3 represent, in my judgment, the “best fit” for the SAFEMAX in column 2.
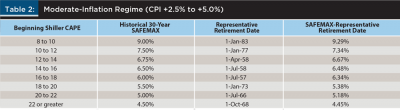
Note that on the same line is listed a “Representative Retirement Date” and associated SAFEMAX. This historical scenario (July 1, 1957, retirement date) is the closest to the one being considered by your client, considering CAPE, CPI, and reasonable “mean reversion” of the CAPE over 30 years. It will become a template for your client’s withdrawal plan, as you will see in Step 2.
The “template scenario” is associated with a SAFEMAX of 6.34 percent, considerably higher than the average of about 6 percent for all the relevant historical scenarios (there are actually 16 scenarios that populate the 16 to 18 CAPE range). Thus, if your client chooses an initial withdrawal rate of 6 percent, and uses the January 1, 1957, scenario as a template, they will automatically have built in a margin of error as protection from future deviations from the plan. We should remind ourselves that using only historical data, we have a very limited data set, and there is probably no satisfactory way to determine these kinds of probabilities with precision.
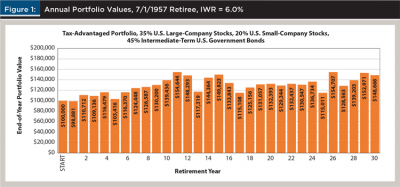
Let’s return to assuming the client chooses a 6 percent withdrawal rate. Figure 1 depicts graphically how the template scenario for a retirement date of July 1, 1957 behaves on a year-by-year basis.
Having established the withdrawal plan, let’s move to Step 2, which concerns monitoring the plan for future deviations.
Step Two: Monitoring the Plan for Deviations
Once a withdrawal plan is established, regular monitoring is recommended (once per year, coincident with a client’s annual review, is probably sufficient).
A productive way to assess the status of a withdrawal plan is through the current withdrawal rate (CWR). The CWR is simply the current year’s dollar withdrawal divided by the nominal value of the portfolio at the beginning of the current year. Figure 2 recasts the data from the template portfolio of July 1, 1957, (using a 6 percent withdrawal rate) into a progression of CWR values.
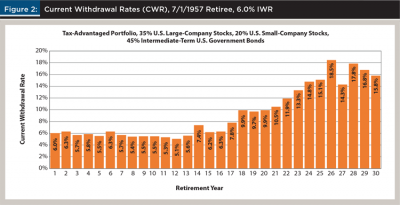
As you can see, in the early years of the portfolio, CWR appeared well-behaved, maintaining itself below the IWR of 6 percent. Beginning in year 14, CWR began a rapid rise into double digits. This coincided with the high inflation of the 1970s, which rapidly inflated dollar withdrawals and, eventually, caused exhaustion of the portfolio in year 37.
CWR, in and of itself, is not a decisive metric as to the sustainability of a withdrawal plan, particularly in its early years. I have studied CWRs for many retirement scenarios, and high CWRs early in retirement can diminish to safer levels later on, while low CWRs early in retirement can explode upwards suddenly and portend imminent portfolio exhaustion.
The method I propose compares the CWR for the template portfolio with the CWR of the client’s live portfolio. I suggest that this comparison be done after the end of each withdrawal year, or calendar year, if more convenient. The important measure is not the absolute value of CWR of the client’s live portfolio, but its value relative to the matching retirement year in the template portfolio.
Let’s look at an example using the July 1, 1957, scenario as a template.
The test client examined retired on Oct. 1, 1989. Their CAPE and CPI metrics matched those of our template. Figure 3 compares the first 20 years of CWRs for our template with the live portfolio of the Oct. 1, 1989, retiree.
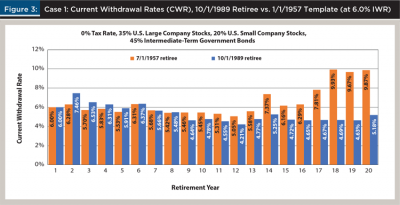
Let’s start our analysis at the far left of the chart. There appears to be concern in year two (Oct. 1, 1990 through Sept. 30, 1991), as the CWR for your client’s live portfolio has jumped to 7.46 percent, while the template reading for the same year is 6.28 percent. Is this a signal that the withdrawal plan is already in trouble?
Actually, no. This is where your experience as a financial planner and your knowledge of markets becomes of great value. The overall portfolio suffered a loss of almost –12 percent and an above-average increase in CPI (inflating second-year withdrawals) during 1991 also contributed to the increase in CWR.
During your year-two review (Sept. 30, 1991), you can tell your client that the markets typically recover after such corrections and that CPI seems to be moderating, and that it may be premature to take any corrective action.
Your prudence is rewarded over the following five years as the “live” CWR gradually approaches the template CWR. In year seven of the plan, they are in a virtual dead heat.
Beginning in year nine, the opposite problem begins to appear: the live CWR begins to outperform the template CWR. By year 14 of the plan, the live CWR is a full two percentage points below the template CWR. Despite the 2000–2002 bear market, the live CWR is at 5.25 percent, well below the starting IWR of 6 percent. In succeeding years, the gap between the two sets of CWRs becomes even greater. Is it time to consider upgrading the client’s plan to a higher withdrawal rate?
It certainly seems that is justified. And in retrospect, the Oct. 1, 1989, retiree is known to have had a SAFEMAX of 7.62 percent, 27 percent higher than the 6 percent withdrawal rate your client began with. This unexpectedly high SAFEMAX was generated in large part by a 63 percent increase in CAPE from beginning to end of retirement (from 17.6 to 28.9), a huge tailwind for stock returns. It is, of course, impossible to foresee such dramatic shifts in stock market valuations. This is why withdrawal plans need to be actively managed. Changing market and economic circumstances can create opportunities and risks during retirement, which should be identified in a timely fashion.
Step Three: Making Adjustments to the Plan
In the case of the Oct. 1, 1989, retiree, by year nine, the client’s “live” portfolio (CWR of 4.64 percent) was substantially outperforming the template portfolio (CWR of 5.46 percent). In year 10—the year we are considering intervention—this pattern continued.
In view of his favorable portfolio experience, the client is interested in increasing his dollar withdrawals. There are two major options for altering the withdrawal plan:
- Maintain the current withdrawal plan (same template), and merely increase the dollar withdrawals, beginning in year 10.
- Create a new withdrawal plan with a new template, including revisiting all the assumptions of the original plan.
Of these two, my preference would be the first option. The template in use still appears to be a valid measuring stick. The template has a longevity of 37 years, significantly beyond the original 30 years required by the client. As long as the CWR curve of the live portfolio remains underneath that of the template, we would expect at least 37 years of portfolio longevity, if not more.
When plan deviations are adverse, we have the same two choices: modify the existing plan or create a new plan from scratch. My preference is almost always to modify the existing plan, unless there are clear indications that economic or market circumstances have changed so drastically—and so permanently—that the underlying assumptions of the original plan no longer apply.
How much should we increase the withdrawal rate in our example? I have a rule of thumb when adjusting a plan: do it gradually. If one change proves insufficient, another can be made. What must be avoided, I believe, is attempting too large an adjustment at one time. You don’t want to shock the client with large cuts when recommending a decrease or put the plan at risk of trouble if market and economic conditions deteriorate after an increase.
To me, a sensible approach would be to increase the tenth year CWR from 4.78 percent to 5.15 percent. That’s slightly less than an 8 percent increase, which is a nice raise for the client. It still leaves a margin of safety below the template CWR of 5.46 percent.
Plan deviations caused by upticks in inflation should be addressed immediately, even if only in limited fashion at first. Inflation is insidious in that it is likely to engorge dollar withdrawals permanently, affecting all future years of the withdrawal plan. Bear markets, on the other hand, are temporary affairs, almost always followed by significant recoveries.
When needed, I would recommend a reduction of around 9 percent. Anything less might cause greater problems in latter years of the plan. Larger cuts could be an overreaction and unnecessarily constrict the client’s lifestyle.
Conclusion
The comprehensive approach to managing retirement withdrawals I present here encapsulates my current thinking. The discussion has focused on a single retirement account. Many clients have multiple accounts in their retirement portfolios, including taxable accounts, IRAs, Roth IRAs, etc. This introduces a degree of complexity not addressed in this paper. To the extent that a client’s account is dominated by a single large account, this approach may still be directly applicable.
I should point out that parts of this management process should be considered under development. In particular, the selection of entries in columns two and three of the tables involved some subjective judgement. Over time, these decisions might be refined.
References
Bengen, William P. 2006. “Conserving Client Portfolios During Retirement.” Denver, CO: FPA Press.
Bengen, William P. 2017. “Fixing a Broken Retirement Withdrawal Plan.” Financial Advisor. Available at www.fa-mag.com/news/fixing-a-broken-retirement-withdrawal-plan-35863.html.
Bengen, William P. 2017. “Small Cap Withdrawal Magic.” Financial Advisor. Available at www.fa-mag.com/news/small-cap-withdrawal-magic-28553.html.
Bengen, William P. 2020. “Choosing the Highest Safe Withdrawal Rate at Retirement.” Financial Advisor. Available at www.fa-mag.com/news/choosing-the-highest-safe-withdrawal-rate-at-retirement-58132.html.
Kitces, Michael. “Resolving the Paradox—Is the Safe Withdrawal Rate Sometimes Too Safe?” The Kitces Report, May 2008.
Kitces, Michael, and Wade Pfau. 2013. “Reducing Retirement Risk with a Rising Equity Glidepath.” Available at papers.ssrn.com/sol3/papers.cfm?abstract_id=2324930.
Stein, Ben, and Phil DeMuth. 2005. “Yes, You Can Still Retire Comfortably.” Carlsbad, CA: New Beginnings Press.
Guyton, Jonathan. 2004. “Decision Rules and Portfolio Management for Retirees: Is the ‘Safe’ Initial Withdrawal Rate Too Safe?” Journal of Financial Planning 17 (10): 54–62.
Guyton, Jonathan, and William J. Klinger. 2006. “Decision Rules and Maximum Withdrawal Rates.” Journal of Financial Planning 19 (4): 50–58.