Journal of Financial Planning: July 2023
Darin Carroll, CFP®, BFA, AAMS, is a financial adviser in Colorado Springs, Colorado. After decades in the investment industry, he remains passionate about the life-changing impact an adviser and a well-executed financial plan can have on client families.
Armahn Hadjian, CFP®, CIMA, is a wealth adviser in Kansas City, Missouri. He has over six years of industry experience and currently serves clients by providing comprehensive financial planning and investment management. Armahn is currently also pursuing his master’s degree in personal financial planning through Kansas State University.
Nathan Collier, CFP®, AIF, is a wealth adviser in Coeur d’ Alene, Idaho. He specializes in private wealth management as well as corporate retirement planning within 401(k), endowment, and pension plans. He is currently a doctoral student in personal financial planning at Kansas State University.
Megan McCoy, Ph.D., LMFT, AFC, CFT-I, is an assistant professor in the personal financial planning program at Kansas State University. Her research focuses on financial therapy and has been published in top-tier family science, marriage and family therapy, and financial journals. Dr. McCoy volunteers for the Financial Therapy Association Board of Directors and serves as the co-editor of the Financial Planning Review.
NOTE: Click on the tables below for PDF versions
We would like to start this article with an anecdote from the experiences of Darin Carroll, one of the authors.
“One year for Father’s Day, I got my father a new house. Well, almost. I did not mean to, mind you. I was 14, and no 14-year-old thinks too far ahead. We had a rusty, metal, 50-gallon drum for burning trash. Being the good son, I had gathered the trash and dutifully burned it. I didn’t realize I had the fire barrel too close to the house. When the fire department arrived, they told us that the fire would have breached the attic within 10 more minutes, and the house would have been a total loss. As it was, there were tens of thousands of dollars in damages. For Father’s Day the following year, I wrote my father a card that said I still hoped to get him a new home. I taped a match to the inside of the card. My father was not amused.”
Fortunately, devastating house fires are rare. Still, while the risk of loss may be low, the dollars at risk are quite high (e.g., the property damage caused by fires is estimated at $15.9 billion in 2021 (Hall and Evarts 2022)). Because of this, no rational person would forgo carrying homeowner’s insurance to mitigate that risk of loss (even in cases in which such protection was optional).
Nevertheless, as financial advisers, we routinely allow our clients to shoulder a particular risk of financial loss that is potentially orders of magnitude higher than the risk represented by the loss of a primary residence—and all too often, we do so without saying a word. We are talking about an almost universal shortfall in adequate disability insurance (DI) coverage, which this article will examine in depth. We imperil our clients, their families, and our professional practices by glossing over the oft-overlooked issue of DI coverage.
In order to fully appreciate the gravity of this problem, we need to know two essential factors: (1) what is the client’s chance of experiencing a loss, and (2) what is the amount the client has at risk. However, first, let us define our terms. When we refer to a disability, we mean being unable to work during earning years (Dalton, Dalton, and Langdon 2018).
Financial advisers view things through the prism of financial impact. We have likely encouraged our clients to have health insurance (probably through an employer) to mitigate the risk of incurring significant medical expenses associated with a health event. In addition, we have likewise prepared our clients to have an adequate cash reserve for emergencies, often enough to fund three to six months of committed expenses (Lee and Hanna 2022).
Since we have probably helped position our clients to withstand the financial loss incurred by a short-term disability, we shall focus our discussion on a disabling event that prevents a client from earning income for a period longer than 90 days. This loss will then coincide with the consumption of the client’s cash reserve fund, which will have been called upon to fulfill its purpose. With that term defined, let us return to the question: How common is a disability? The answer is: surprisingly common.
Chance of Experiencing a Loss and Amount at Risk
According to the 2021 Long-Term Disability Claims Review published by the Council for Disability Awareness (2021), the chances of a healthy 35-year-old experiencing a disability before retirement age are roughly one in four. That number is much too high for prudent financial advisers to ignore.
We gain some perspective by using comparison as we consider how common a long-term disabling event is. According to two 2020 reports from the National Fire Protection Association, about one in 300 homes in a year will experience a fire of any size (2020a), and about 3.7 percent of those will result in a total loss of the structure (2020b). Simply put, the odds of someone losing their home to a fire are one in 8,100. To recap, losing one’s ability to earn income because of disability is over 2,000 times more likely than having one’s house burn down. The odds of being in a car crash are one in 19. Here again, the odds of experiencing a disability are 4.75 times higher than that.
As to the amount at risk, this is merely a rote function of loss of income times the length of time. According to the U.S. Census Bureau (2020), the median annual salary for someone who is under 65 years old is $46,360. It is possible, then, that a 35-year-old worker with a long-term disabling event could potentially have more than $1.3 million at risk until Social Security full retirement age. This risk becomes even more significant when we factor in expected pay raises over the years.
Would any prudent adviser permit a client to go uninsured against those risks—a one in 8,100 chance of losing one’s home or a one in 19 chance of being in an automobile accident—if the client were permitted to do so? Almost certainly not. However, if we allow a client to leave our office without educating them on the much more significant risk of a disability and an amount at risk orders of magnitude higher than other risks they almost certainly insure appropriately, then we have failed in the foundational duty to which we have been entrusted: promoting and protecting their financial well-being.
Comparing Disability Insurance to Other Common Insurance Coverages
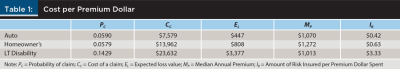
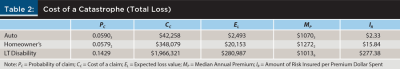
In addition to the higher risk of needing disability insurance above other types of insurance coverage, another way to illustrate the benefits of long-term disability insurance is through a cost comparison. To explore the cost comparison, we will first evaluate the amount of potential loss covered for the typical insurance coverages (e.g., auto, homeowner’s, and disability), given the premium paid for the coverage.
The methodology for this demonstration is to determine an expected loss value by multiplying the probability of a claim by the cost of a claim for any given type of insurance. Then divide this expected loss value into the median premium paid for a particular insurance, providing the amount of risk insured per premium dollar spent. Thus, we might say:

One challenge in this area is the available data’s granularity surrounding average loss and average premium. The insurance industry is highly fragmented; thus, compiling reliable data to analyze requires careful consideration when making comparisons. Therefore, there may be some error associated with the equation, but Table 1 attempts to illustrate the average amount of risk insured per premium dollar spent on average utilizing numbers from the Insurance Information Institute on auto (n.d.) and home insurance (n.d.) and U.S. Census data (2020a, 2020b).
Increased Need for Clients with Advanced Education
The need for disability coverage is even more pronounced for clients who have completed a bachelor’s degree or beyond. There is significant empirical data to suggest that there is a strong link between education and lifetime earnings. The average cost of attending a public in-state institution is $25,707 (Hanson 2022). This annual cost implies a total cost of acquiring a bachelor’s degree of $102,828. For a master’s degree, the implied cost is around $154,242. While these costs are high, there is still compelling data suggesting it is an excellent long-term investment. As Bowers and Bergman (2016) describe, individuals with a bachelor’s degree will earn well over $1 million more than those with a high school degree during their careers. Clearly, investment in education is an excellent decision. However, forgoing appropriate disability insurance may negate such an intelligent decision by increasing risk exposure.
All the figures about increased lifetime earnings presume an individual can work an entire career free from disability and loss of income. If someone who has invested significant resources into their education experiences a long-term disability, they will incur a double blow. The money to purchase education is gone; it is a sunk cost. Long-term disability could make it impossible ever to realize that excellent ROI. Such a disabling event would mean that in the absence of appropriate long-term disability coverage, a severe disability could change an excellent investment into a bad one.
Categories of DI Policies
Additionally, when considering a disability insurance policy, it is essential to understand its type. There are essentially three types of policies: any occupation, own occupation, or split definition.
Own-occupation policies state that if the insured cannot perform every duty associated with their own occupation, the insured is deemed disabled, and the policy will pay benefits (Dalton, Dalton, and Langdon 2018). These are typically more expensive policies to purchase. By contrast, any-occupation policies benefit a policyholder if they cannot perform the duties of any occupation for which they are qualified based on education, training, or experience (Dalton, Dalton, and Langdon 2018). Any occupation is typically the cheapest policy to purchase.
Why is this distinction significant? Consider an experienced dentist who is making $225,000 per year. If a severe car accident leaves the dentist unable to move their hands as they once did and perform dental work, they may no longer be able to practice as a dentist. An own-occupation definition means they would qualify to receive disability payments because they can no longer work as a dentist. An any-occupation definition means they may not qualify to receive benefits under the disability insurance policy because they could still perform another job for which they are qualified, even if the income from that job pays significantly less than what they made in their own occupation. For example, a dentist who loses hand function could still teach biology at a community college. The salary for this job might only be $80,000 per year, but they are qualified to do it, and it is available.
The split definition policy is a hybrid of own-occupation and any-occupation. Typically, split definition coverage means that the insured is eligible for the benefit if unable to perform their given occupation policy for the first period of benefit (generally two years) before becoming an any-occupation policy (Dalton, Dalton, and Langdon 2018). These policies are typically group policies provided by the employer. A cursory understanding of the different types of policies reinforces the fact that, often, employer-provided disability insurance is inadequate. Such an inadequacy may leave the insured financially vulnerable in the event of a long-term disability. With the odds of experiencing a long-term disability event, this risk is not worth carrying, especially if the insured has advanced education and training.
Why is DI coverage so frequently overlooked? It is easy to see that disability is common and often devastatingly expensive. So why do clients (and their advisers) focus less on disability insurance than they should? Unfortunately, those with DI benefits at work probably assume that their coverage is adequate. There may be a further assumption that personal coverage is too expensive. Some even consciously plan to rely on Social Security Disability Insurance (SSDI) should disability benefits be needed.
The Client Has Coverage at Work
Even if the client has DI coverage at work, it may be inadequate. Typically, group DI coverage is a great start, but close inspection may show that supplementing with a personal policy is indicated. Most long-term group coverage will kick in after a 90-day wait, also called an elimination period (Contreary, Ben-Shalom, and Gifford 2018). At that point, most group coverage will pay 60 percent of the salary for the policy duration (Autor, Duggan, and Gruber 2014). At first blush, the client likely assumes all is well. Nevertheless, within most group plans lie hidden dangers.
Payments from group long-term DI coverage commonly have one of three payment durations, after which the claim has no further payment. Those durations can last as little as two or three years or until the claimant reaches age 65 (Opiela 2004). At the end of the claim period defined within the group disability policy, no further payments are issued. However, even though the insurance payments have come to a contractual end does not necessarily mean the client is ready and able to work again.
The client should closely examine if getting 60 percent of their income for two or three years derails their ability to fund their financial goals. Further, suppose that limited income continues until age 65. In that case, the client would likely be hard-pressed to fund retirement, college for the kids, life insurance, and other critical objectives while still having enough money to live.
As mentioned, many long-term disability policies provide 60 percent income replacement (Monaco 2015). However, an often-overlooked detail is the taxation of disability benefits. If an employee has a policy through work and their employer is paying the premiums for coverage, all of the benefits that the individual receives in the event of a disability claim would be taxable to them. Conversely, when the individual pays the premiums themself, benefits received under the claim are not subject to income tax (Dalton, Dalton, and Langdon 2018).
Knowing who pays the premium is essential in determining the adequacy of coverage. Failing to acknowledge that a group policy paid for by the employer would result in taxable benefits could lead to a false sense that the insured employee, if frugal, might be able to support themselves in the event of a claim. If they have not considered the taxation of their benefit, the employee might not have enough income after all after taxes.
Compounding the problem further is that while SSDI is indexed to inflation (Peck 2023), it does not necessarily keep pace with inflation. Over an extended period, those who rely solely on SSDI could see their purchasing power lose pace with the cost of living. A younger worker who assumes that the employer’s “until 65” coverage is OK probably failed to consider that the cost of essential goods and services will rise dramatically over the years. In the face of a long-term disability, this may be tantamount to a slow financial death on the installment plan. Sound dramatic? It is. It is also that dire when funding financial goals (and sometimes even fundamental financial solvency) becomes exponentially more challenging over time.
Another thing to consider when reviewing group coverage is that commissions and bonuses are not part of DI coverage calculations. Sponsors establish coverage using salary-only as the baseline. Further, most group coverage includes a cap. While 60 percent is the standard percentage of salary protected, the highly compensated employee may be in for an unpleasant surprise to learn of that cap. For instance, a policy may state that 60 percent of the insured’s income is protected, with a maximum $5,000 monthly benefit. The employee earning a $200,000 salary, expecting to get $120,000 a year upon disability, would likely be unprepared—even irreparably damaged—to receive only $60,000 a year.
The final consideration for those who think their group coverage is good enough is that group DI coverage is seldom portable. If the employee is fired, laid off, or changes employers, or if the company goes out of business or drops coverage, there is a chance the employee will end up with no DI protection. Furthermore, if this happens to an employee who experienced health changes, getting a new, personally owned DI policy at that point may be impossible.
The Client Assumes DI Is Too Expensive
We have already seen that the costly premiums of a DI policy buy much leverage; a large benefit pool of income dollars becomes available to the insured. When explained, this leverage is especially attractive to consumers when they consider the cost–benefit of coverage they already own, such as homeowner’s insurance and comprehensive and collision (full coverage) for vehicles.
That said, DI coverage is empirically expensive. Nevertheless, disability is relatively likely and can be costly to the point of devastation. DI coverage provides a life-changing benefit for those who experience an illness or injury that triggers coverage. That is why disability insurance is expensive and why clients need it.
Imagine a 35-year-old female, faced with the choice to buy DI or life insurance coverage (both necessities), opts for life insurance coverage because DI is “too expensive.” So, she chooses to purchase a $250,000 life insurance policy, which protects her family, for that amount, in the unlikely event she dies prematurely. On the other hand, if she bought a $2,500/month disability income policy and suffered a disability (which is not very unlikely), the insurance company would owe her $2,500 per month—for as many as 30 years. That would be as much as $900,000 in claims.
The Client Plans to Rely on Social Security Disability (SSDI)
It is dangerous to allow the client to trust Social Security Disability Insurance (SSDI) to provide financial stability if faced with a disabling event. Even those fortunate enough to successfully run the gantlet of the governmental red tape of filing a Social Security disability claim are faced with a long wait to qualify, often two years (Scott and Finke 2013). Even if the client has a large enough cash reserve to last through the long waiting period, the amount of the monthly SSDI payments that eventually come in may be woefully inadequate.
In order to know just how much SSDI will pay, one must understand how the Social Security Administration calculates this number. The SSA (2022) uses a complex weighted formula to calculate benefits for each person, so the amount of money received from Social Security every month is unique for each individual. Social Security computes retirement and disability payments on the income upon which Social Security taxes are assessed—called “covered earnings.” The average covered earnings over the years are known as average indexed monthly earnings (AIME). A formula is applied to the applicant’s AIME to calculate the primary insurance amount (PIA), the base figure that the SSA uses to set the benefit amount. The formula consists of fixed percentages of different amounts of income (bend points), which are adjusted each year. For example, in 2023, 90 percent of the first $1,115 of AIME was added to the PIA, plus 32 percent of AIME from $1,115 to $6,721, plus 15 percent of AIME over $6,721, for those becoming disabled before age 62. The sum of these amounts represents the final PIA.
Here is the bottom line. The average SSDI payment in 2023 will be $1,358, with the maximum disability benefit being $3,627 (Peck 2023).
The SSA’s Annual Statistical Report on the Social Security Disability Insurance Program (2020) reveals that nearly 65 percent of all Social Security Disability Insurance (SSDI) claims are denied at the first application or upon the first reconsideration. This denial may require the client to secure legal services to acquire benefits, though a protracted delay is all but assured. Those lucky enough to qualify for SSDI can expect to win the kingly sum of $1,358 a month, on average (Peck 2023). Armed with that knowledge, the client may well deem that stipend inadequate to pay basic expenses, much less fund future financial goals. Nevertheless, that is what awaits the client if personal or group DI coverage gets declined, and the SSA is the client’s only source of disability income.
We, as financial advisers, have the highest of callings. We take the hopes and dreams of our clients and use them to create a roadmap to allow those clients to reach their destinations. By helping our clients live in a way consistent with their values, we enable those we serve to live a life more worth living as they have defined it. Moreover, we ensure that the good our clients wish to do with their lives will long outlive the clients themselves. What a sacred trust this is; what a profound responsibility. The only logical and moral response is to give them our utmost, even—or especially—in the details that may seem, on the surface, to be minor.
However, while the client defines the dream and we are the envoy to walk the path with them, the ability to do so always springs from the client’s financial condition. Their assets, along with those hopes and dreams, are all too often at grave risk. As professionals, we cannot be cavalier about the risk of disability or dismissive about examining their coverage. We should use the coverages the client already prudently owns as the starting point for a discussion.
The clients look to us for wisdom. The wise will protect that which matters.
What could be wiser than protecting the clients’ most significant asset, their ability to earn an income? When clients already protect the things that are less costly and less likely to be lost, how much easier will the conversation be for the trusted financial adviser helping the client protect a life’s work?
Conclusion
The purpose of this article is a call for practitioners to reflect upon their own potential biases against disability insurance. A predisposition by advisers to gloss over the disability needs of a client may lead to underutilization of disability insurance, which could expose the client—and the practitioner—to unnecessary risk. Of course, there is a caveat that is required. There are times when DI may not be appropriate.
- Financial independence—Some client families may have acquired enough wealth that disability insurance is not necessary to protect the family. If a client’s family has attained financial independence, then a disability policy—which is a tool to help replace lost income—may be an unnecessary expense. To determine if that finish line has already been crossed, the adviser and client should consider a comprehensive analysis, such as a financial plan.
- Entering the later years in life—It is important to note that many disability insurance policies only pay until age 66 or 67 (Dahl 2010). Hence, the remaining lifetime value of DI decreases over time. At the same time, however, premiums can become much more expensive with advancing age. There comes a breakeven point at which DI coverage may no longer make sense. Again, a detailed financial plan may be a prudent step to assess both the need and value of a disability policy to a pre-retirement client.
- Struggling for solvency—It is an unfortunate truth that some families have such limited resources that the certain cost of disability insurance needs to be weighed against the uncertainty of loss from a disability. Indeed, many families struggle to put food on the table and cannot afford a 2–3 percent of income premium expense (Scott and Finke 2013). It is a hard choice, but a family on the brink of insolvency may have that problem compounded by the burden of DI premiums. In such a situation, going without DI protection may be unavoidable. In that case, if no disabling event occurs, the family might find their financial footing. A practitioner working with this type of client family has a professional and moral obligation to at least advise the family of the risk and encourage the family to avail themselves of employer-sponsored DI coverage, if possible. Such coverage, though limited, could provide some measure of protection.
Despite these caveats, we hope this article serves as a reflection point for practitioners to explore their own biases around disability insurance to ensure we provide our clients with the optimal advice. Too often, disability insurance is an overlooked part of a comprehensive financial plan. At a minimum, fiduciary advisers should have a detailed conversation with their clients regarding the impacts of under-insuring for disability.
References
Autor, David, Mark Duggan, and Jonathan Gruber. 2014. “Moral Hazard and Claims Deterrence in Private Disability Insurance.” American Economic Journal: Applied Economics 6 (4): 110–141.
Bowers, Amanda, and Matt Bergman. 2016. “Affordability and the Return on Investment of College Completion: Unique Challenges and Opportunities for Adult Learners.” The Journal of Continuing Higher Education 64 (3): 144–151.
Council for Disability Awareness. 2021, May. 2021 Long-Term Disability Claims Review. Retrieved April 5, 2023. https://disabilitycouncil.org/survey/2021-LTD-Claims-Review.pdf.
Contreary, Kara, Yonatan Ben-Shalom, and Brian Gifford. 2018. “Using Predictive Analytics for Early Identification of Short-Term Disability Claimants Who Exhaust Their Benefits.” Journal of Occupational Rehabilitation 28: 584–596.
Dahl, Molly. 2010. Social Security Disability Insurance: Participation Trends and Their Fiscal Implications. Collingdale: DIANE Publishing.
Dalton, James F., Michael A. Dalton, and Thomas P. Langdon. 2018. Insurance Planning. 6th ed. New Orleans: Money Education Publishers.
Hall, Shelby, and Ben Evarts. 2022. “Fire Loss in the United States during 2021.” National Fire Protection Association. www.nfpa.org/~/media/fd0144a044c84fc5baf90c05c04890b7.ashx.
Hanson, Melanie. 2022. “Average Cost of College and Tuition.” https://educationdata.org/average-cost-of-college.
Insurance Information Institute. n.d. “Auto Insurance.” www.iii.org/fact-statistic/facts-statistics-auto-insurance.
Insurance Information Institute. n.d. “Homeowners and Renters Insurance.” www.iii.org/fact-statistic/facts-statistics-homeowners-and-renters-insurance.
Lee, Sunwoo Tessa, and Sherman D. Hanna. 2022. “What, Me Worry? Financial Knowledge Overconfidence and the Perception of Emergency Fund Needs.” Journal of Financial Counseling and Planning 33 (1): 140–155.
Monaco, Kristen. 2015. “Disability Insurance Plans: Trends in Employee Access and Employer Costs.” U.S. Bureau of Labor and Statistics. www.bls.gov/opub/btn/volume-4/disability-insurance-plans.htm#_edn6.
National Fire Protection Association. 2020a, January. “U.S. Home Structure Fires. Home Fires Facts Sheet.” Retrieved April 5, 2023. www.nfpa.org/-/media/Files/News-and-Research/Fire-statistics-and-reports/Fact-sheets/HomeFiresFactSheet.ashx.
National Fire Protection Association. 2020b, November. “Home Fires Involving Cooking Equipment.” Retrieved April 5, 2023. www.nfpa.org/-/media/Files/News-and-Research/Fire-statistics-and-reports/Factsheets/HomeFiresInvolvingCookingEquipmentFactSheet.ashx.
Opiela, N. 2004. “Disability Insurance: Are Your Clients Truly Protected?” Journal of Financial Planning 17 (4): 40.
Peck, Brittany. 2023. “Social Security Disability Benefits Pay Chart.” www.evansdisability.com/blog/social-security-disability-benefits-pay-chart/.
Scott, Janine K., and Michael S. Finke. 2013. “The Demand for Disability Insurance.” Financial Services Review 22 (1): 1–12.
U.S. Census Bureau. 2020a. “Income and Poverty in the United States.” www.census.gov/content/dam/Census/library/publications/2021/demo/p60–273.pdf.
U.S. Census Bureau. 2020b. “Median Household Income and Percent Change by Selected Characteristics.” www.census.gov/content/dam/Census/library/visualizations/2021/demo/p60-273/figure1.pdf.