Journal of Financial Planning: January 2026
NOTE: Please be aware that the audio version, created with Amazon Polly, may contain mispronunciations.
Executive Summary
- This study investigates the relationship between self-reported financial risk tolerance and actual investment behaviors.
- Data were collected via an online Qualtrics survey using participants from the Precision Sample research panel in mid-2023. The sample was intentionally designed to include individuals actively managing their household investments, with targeted weighting to overrepresent high-earning households (combined incomes of $200,000–$300,000) and high-net-worth investors (net worth exceeding $1 million, excluding primary residences and associated loans).
- General linear model analyses demonstrated that risk tolerance, as measured by the Survey of Consumer Finances (SCF) risk-tolerance scale, was a significant descriptor of portfolio allocation composition and portfolio risk, independent of wealth, education, age, and other demographic covariates.
- Investors reporting higher risk tolerance held a broader set of investments and constructed riskier portfolios, with a clear progression across SCF categories. Net worth and educational attainment were also significantly associated with portfolio outcomes, whereas other demographics showed mixed effects.
- Findings underscore the dual role of financial capacity and psychological willingness to take risks in describing investment behavior. Implications for financial advisory practice, client segmentation, and investor protection policies are presented.
Dr. John Grable, CFP®, is a University of Georgia professor and leading scholar in topics related to financial risk tolerance and personal finance. Dr. Grable has authored more than 150 papers, co-edited major journals, and published several field textbooks.
Dr. Swarn Chatterjee, a professor at the University of Georgia, conducts research that examines financial planning performance, the link between financial well-being and health across populations, and factors that enhance financial decision-making among young adults and older households.
The authors gratefully acknowledge Dr. Dee Warmath for her central role in conceptualizing and overseeing the data collection process that formed the foundation of this paper. Dr. Warmath’s insightful guidance, strategic expertise, and thoughtful contributions significantly enriched the development and refinement of the research.
Disclosure: The authors utilized Grammarly (an automated grammar and style-checking software) for copyediting purposes. Responsibility for the accuracy, interpretation, and conclusions of the manuscript rests solely with the authors.
The Investor Protection Trust provided funding for this study. The project was reviewed and approved by the University of Georgia Institutional Review Board (IRB), under protocol number PROJECT00007488.
NOTE: Click on the images below for PDF versions.
JOIN THE DISCUSSION: Discuss this article with fellow FPA Members through FPA's Knowledge Circles.
FEEDBACK: If you have any questions or comments on this article, please contact the editor HERE.
Understanding how an investor’s risk tolerance, defined as a person’s willingness to engage in a behavior where the outcome is uncertain and potentially negative (Rabbani and Nobre 2022), translates into actual risk-taking behavior is a central concern for those who provide financial advice at the individual and household level. Understanding the association between someone’s risk attitude and their investment choices is also of interest to policymakers and regulators. Traditional investment allocation models assume that financial capacity proxies (e.g., wealth, income, and education) are the primary determinants of investment choices at the household level (Borrelli and Villanova 2025; Crockett and Friend 1967; Makarov and Schornick 2010), but growing evidence suggests that a person’s willingness to take risk, independent of risk-taking capacity, also plays an important role in describing portfolio composition (Aggarwal 2025; Corter and Chen 2006; Heo et al. 2016). Accurately capturing this attitudinal component of investing is essential for designing suitable investment recommendations, assessing investor accreditation status, and improving theoretical models of portfolio choice.
While it is widely recognized that individuals with greater financial risk tolerance tend to make riskier investment choices, the relationship between self-reported risk tolerance and portfolio allocation composition remains underexplored. Specifically, little is known about how well risk tolerance describes the breadth of investments held in portfolios, while controlling for factors such as wealth, education, and other demographic characteristics. Gaining insight into this association is important because exposure to a variety of investment types is a cornerstone of modern portfolio theory. Through the use of investments with varying degrees of risk and return tradeoffs, it is possible to achieve greater risk-adjusted returns (Modigliani and Leah 1997). Mismatches between risk tolerance and portfolio allocation composition can lead to suboptimal portfolio construction, which can heighten vulnerability to market downturns and derail an investor’s long-term financial goals (Park and Yao 2016). By clarifying the relationship between risk tolerance and investment allocation decisions, financial advisers can provide more tailored, client-centered recommendations. In this regard, the purpose of this paper is to document whether an association between financial risk tolerance and portfolio allocation composition exists in practice. The study also provides evidence to the extent to which self-reported financial risk tolerance describes the overall riskiness of investor portfolios, as well as the degree to which demographic and socioeconomic factors (e.g., age, net worth, educational attainment) are associated with risk tolerance in describing investment choices.
Literature Review
Securities regulators worldwide (e.g., Securities and Exchange Commission (SEC), the Financial Industry Regulatory Authority (FINRA), the Securities Industry and Financial Markets Association (SIFMA), the Canadian Investment Regulatory Organization (CIRO), the Financial Conduct Authority (FCA) in the United Kingdom, and the European Securities and Markets Authority (ESMA)) require financial advisers to assess the financial risk tolerance of clients before making financial and investment recommendations. Standards of practice fall under general Know Your Client (KYC) frameworks. Nearly all financial advisers and firms use some type of risk-tolerance questionnaire or test to meet KYC requirements (Tahvildari 2025). Subjective client assessments are popular because they meet regulatory guidelines. SIFMA, for example, encourages the use of structured, repeatable processes, such as psychometric tools and data-driven platforms that align with the design of questionnaires (Varley 2007).
A complicating factor in the required regulatory risk-tolerance assessment process is that the SEC (and some other regulators) allows financial firms and advisers to bypass the use of risk-tolerance assessments as a portfolio risk constraint when working with some clients. This applies particularly to security-offering firms and financial advisers who provide access to highly speculative investment markets (i.e., private placements). This loophole in U.S. regulations falls under accredited investor rules, which allow some investors to purchase private placements without regard to their risk tolerance. Accredited investor rules are based on an investor’s risk capacity rather than risk tolerance (Lee 2011), where risk capacity refers to the objective financial ability of a financial decision-maker to absorb losses without jeopardizing their financial objectives (Cordell 2002; Kwak and Grable 2024). Capacity can be assessed using objective measures such as income and wealth (Aggarwal 2025).
Under current rules, an accredited investor is someone who (1) has earned income that exceeded $200,000 (or $300,000 together with a spouse or spousal equivalent) in each of the prior two years and reasonably expects the same for the current year; (2) has a net worth over $1 million, either alone or together with a spouse or spousal equivalent (excluding the value of the person’s primary residence and any loans secured by the residence (up to the value of the residence)); or (3) is a broker or other financial professional holding certain certifications, designations, or credentials in good standing, including a Series 7, 65, or 82 license (SEC n.d.). Regulators assume that someone with sufficient financial capacity can deal with financial losses, understand the nature of illiquidity in relation to subsequent selling, and be willing to accept investment risk with limited financial disclosures. Whether risk capacity, risk tolerance, or a combination of the two is more appropriate as a precursor to providing investment advice is one outcome associated with this study.
Assessing Financial Risk Tolerance
Two approaches dominate the way in which financial risk tolerance is typically assessed (Grable et al. 2020). The first is the use of stated-preference items that ask an investor to subjectively indicate their willingness to take a risk. Stated-preference tests can range from as simple as a single item to as complicated as multi-item questionnaires. The alternative approach is to gauge past and current investing behavior as an indicator of future action. This is referred to as a revealed-preference test or outcome measure.
One of the most commonly used stated-preference items was introduced in the 2016 SCF. Since its introduction, the single-item SCF question has been used hundreds of times in published studies. Although some have criticized the item and other similarly worded assessments, stated-preference items (like the SCF question) tend to perform satisfactorily when subjected to validity tests (Grable and Schumm 2010). Answers to the SCF question do reasonably well in describing a person’s willingness to take financial risks (Kim et al. 2021).
Ideally, a stated-preference test score should correlate highly with a revealed-preference outcome. For example, someone who reports being very willing to take financial risks should, in fact, take greater portfolio risk compared to others. This is what Grable and Lytton (2001), Corter and Chen (2006), Nosita et al. (2020), and Yao and Rabbani (2021) have observed in practice.
Surprisingly, little is known about the direct relationship between risk tolerance and the composition of portfolio allocations. What is known matches what Goetzmann and Kumar (2008) and Sages and Grable (2010) reported. Specifically, U.S. investors tend to be under-diversified. The lack of broad investment allocation is particularly strong among younger, lower-income, less educated, and less sophisticated investors. Statman (2004) also noted that the portfolios of a large portion of the investing public lack broad allocation composition. Statman explained the tendency to concentrate portfolios on factors like overconfidence, emotional attachment to assets, feelings of control, and market constraints.
Portfolio allocation decisions may also be related to an investor’s risk tolerance. As described in modern portfolio theory, rational investors should seek to either maximize expected returns while maintaining a constrained level of risk or minimize risk while targeting a specific expected return. Investors do this by constructing efficient portfolios along the efficient frontier by combining assets with low or negative correlations. Adding more investments across sectors to a portfolio typically reduces total risk without proportionally sacrificing returns, assuming imperfect correlations (Wagner and Lau 1971). Pursuing pure return maximization, absent risk constraints, may lead to concentrated positions in high-expected-return assets; however, this approach exposes investors to unnecessary unsystematic risk, which deviates from theoretical efficiency. For example, an investor with a low tolerance for risk might diversify across a narrow set of low-volatility assets (e.g., bonds and cash equivalents) to minimize overall portfolio volatility. In contrast, an investor with high risk tolerance might strive for greater exposure to different types of investments, especially high-risk assets (e.g., equities, commodities, and investment alternatives), as a way to optimize the risk-return tradeoff (i.e., attempt to maximize expected returns while minimizing idiosyncratic risks through correlational associations). To date, this and other portfolio allocation composition possibilities associated with financial risk tolerance have been underexplored.
Factors Associated with Financial Risk Tolerance
In this study, a broad set of demographic and socioeconomic characteristics was examined as potential correlates of portfolio allocation composition and portfolio risk. These variables (i.e., age, gender, marital status, race/ethnicity, education, income, net worth, and employment status) were selected because they align with those most commonly used as controls in empirical research on financial risk tolerance (Gondaliya and Dhinaiya 2016).
Prior research has identified several consistent patterns in the associations between the demographic and socioeconomic variables used in this study and financial risk tolerance and risk-taking behavior, although some findings remain context dependent. For example, gender effects are relatively uniform, with men, on average, reporting a greater willingness to take financial risk compared with women (Anbar and Eker 2010; Chavali and Mohanraj 2016; Grable and Roszkowski 2007; Hallahan et al. 2004; Larkin et al. 2013). The age relationship is more nuanced. Brooks et al. (2019), Gibson et al. (2013), Hallahan et al. (2004), Sung and Hanna (1996), and Yao et al. (2011) documented a positive relationship between risk tolerance and age, which contrasts with the common assumption that risk tolerance declines over the life cycle (Kuzniak and Grable 2017).
The literature on marital status presents more nuanced conclusions (Heo et al. 2016). Some studies suggest that being married enhances household risk capacity by allowing potential losses to be absorbed across two individuals (Brooks et al. 2019). Others argue that single individuals exhibit higher risk tolerance precisely because losses do not directly affect another household member (Hallahan et al. 2004; Wong 2011). Racial and ethnic differences in risk tolerance have also been observed, with some evidence indicating that identifying as non-Hispanic White is positively associated with risk-taking behavior (Ferreira and Dickason-Koekemooer 2020; Fisher 2019). However, the direction and magnitude of racial/ethnic effects vary across studies, suggesting that the relationship may be moderated by other factors such as socioeconomic context.
Socioeconomic indicators, including education, household income, and net worth, are among the most consistently reported positive correlates of risk tolerance (Hallahan et al. 2004; Kruger et al. 2017; Pinjisakikool 2017; Wong 2011). Higher education and wealth are believed to enhance an investor’s ability to bear financial risk, thereby fostering a greater willingness to assume financial risks. Employment status functions similarly. Full-time employment, in particular, is associated with stronger household risk capacity, which may translate into riskier portfolio holdings (Anbar and Eker 2010; Chang et al. 2004; Gondaliya and Dhinaiya 2016; Grable 2000).
The remainder of this paper focuses on providing information about the dataset, sample characteristics, and the methodological approach employed to determine the relationship between financial risk tolerance, portfolio allocation composition, and portfolio risk. The paper concludes with a discussion of the results.
Methods
Data and Sample
The data utilized in this study were obtained through a structured online survey administered via the Qualtrics platform. Recruitment was conducted through the Precision Sample research panel, a nationally recognized provider of targeted survey participants. Data collection occurred over a five-week period in mid-2023. The sampling strategy was deliberately designed to capture a population of individuals who were actively engaged in the management of their household investment portfolios at the time of participation. This focus ensured that participants possessed relevant financial decision-making experience and were likely to provide informed responses regarding investment behaviors and preferences.
To enhance the relevance of the findings for high-net-worth and high-income investor segments, the sample was purposefully weighted to include a disproportionate representation of individuals meeting accredited investor financial criteria. Specifically, some participants were selected to reflect (1) high-income households, defined as those with annual incomes ranging from $200,000 to $300,000 (this threshold included both individual and combined household incomes (e.g., with a spouse or partner)); and (2) high-net-worth individuals, defined as those with a net worth exceeding $1 million. Importantly, net worth calculations excluded the value of primary residences and any mortgage or loan obligations secured by those residences, up to the appraised value of the property. This exclusion was intended to isolate investable assets and provide a more accurate representation of financial capacity. Others in the sample represented traditional household financial decision-makers. All variables included in the analysis were fully populated, with no missing data.
Variables
Two outcome variables were evaluated in this study: portfolio allocation composition and portfolio risk. Allocation composition was measured using a summed index based on whether a participant indicated owning one or more of the following nine assets (yes/no): (1) bonds, (2) stocks, (3) exchange-traded funds (ETFs), (4) mutual funds, (5) hedge funds, (6) private placements, (7) commodities, (8) cryptocurrencies, and (9) other, including non-tangible assets, art, commercial real estate, etc. The default investment category was cash and cash equivalents. The number of holdings owned ranged from zero to eight. Table 1 shows the distribution of asset ownership across the sample.

The portfolio risk variable was estimated in three ways using various investment risk-scoring methodologies, including volatility metrics and online portfolio risk frameworks.1 With the first estimate, a weight was assigned to each of the assets shown in table 2, ranging from 0 (very low risk, very low return) to 9 (high risk, high return). Table 2 shows the scoring system. Scores ranged from 0 to 36. The mean, median, and standard deviation scores were 10.78, 8.00, and 8.76, respectively.
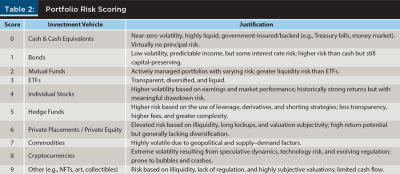
The scoring system presented in table 2 incorporated expert judgment and known risk factors derived from academic studies and institutional practices.2 The scoring methodology used insights from Markowitz (1952), Pedersen et al. (2014), and Bruder et al. (2022). Specifically, the scoring system was created based on the notion that risk can be proxied by price volatility and that illiquid and opaque investments carry additional risk beyond volatility. The scoring system also assumed that assets with high skewness, kurtosis, or downside uncertainty are riskier.3
The scoring system (0 = very low risk to 9 = high risk) aligns well with established financial principles and models, particularly the “investment risk pyramid” and the “risk ladder,” which categorize assets from the safest to the most speculative. The risk pyramid is widely used by financial educators and planners to guide asset allocation decisions based on volatility, liquidity, historical returns, and potential for loss (Grable and Palmer 2024; Investopedia 2023). To maintain comparability, each score was chosen to represent a step change based on volatility, liquidity, complexity, tail risk, and regulatory risk. Portfolio risk scores were estimated as follows:
Portfolio Risk Score = Σ (Ownership Indicator i × Risk Score i) for i = 0 to 9,
where Ownership Indicator i = 1 if the participant owned the i-th investment type, 0 otherwise, and Risk Score i = the predefined risk level for that investment (e.g., 1 for bonds, ... , 9 for Other, like NFTs/art/collectibles). For example, if someone owned ETFs (2), individual stocks (4), and cryptocurrencies (8), but nothing else, the score would be (0×0) + (0×1) + (1×2) + (0×3) + (1×4) + (0×5) + (0×6) + (0×7) + (1×8) + (0×9) = 2 + 4 + 8 = 14. Using this scoring framework, higher scores represent portfolios with greater risk.
The second scoring procedure used in this study corresponds to one used by Corter and Chen (2006). An ordinal score (i.e., weight) was matched to three investments from table 2: bonds, stocks, and cryptocurrencies. These weights were used to compute a composite portfolio risk score for each participant, with the score representing the overall riskiness of their portfolio. Bonds (low risk, low return) were coded 1. Stocks (medium risk, medium return) were coded 2. Cryptocurrencies (high risk, high return) were coded 3. A revised portfolio risk score was estimated as follows:
Revised Portfolio Risk Score = Σ (Ownership Indicator i × Risk Score i) for i = 1, 2, or 3,
where Ownership Indicator i = 1 if the participant owned bonds, i = 2 if the participant owned stocks, and i = 3 if the participant owned cryptocurrencies. Scores ranged from 0 to 6. The mean, median, and standard deviation for the scores were 2.55, 2.00, and 2.09, respectively.
The third scoring method used a modified Herfindahl-Hirschman Index (HHI). HHI values account for the degree of concentration in a portfolio (Brezina et al. 2016). Specifically, HHI scores quantify the concentration of a portfolio across its holdings (Woerheide and Persson 1992). HHI was used in this study to reduce the subjective nature of the previous scoring systems. HHI was calculated as HHI = 1/N, where N represents portfolio allocation composition from table 2. The HHI estimate was then adjusted using the following formula:
HHI Adjusted Risk Score = Original Risk Score (from the first estimation) × (1 − HHI)
HHI scores ranged from 0 to 31.50. The mean, median, and standard deviation scores were 6.85, 4.67, and 8.15, respectively.
The primary independent variable was financial risk tolerance (FRT). FRT was assessed using a question from the 2016 SCF. The item was presented to participants as follows:
On a scale from zero to 10, where zero is not at all willing to take risks and 10 is very willing to take risks, what number would you (and your {husband/wife/partner}) be on the scale?
Given the response categories, participant scores could range from 0 to 10. The mean, median, and standard deviation scores for the item were 7.11, 7.00, and 2.44, respectively.
Model covariates included age, gender, marital status, race/ethnicity, education, household income, net worth, and employment status. Age was measured as a continuous variable in years. The valid range in the sample was 18 to 99, with a mean of 43.81 (SD = 13.75). Gender was a dichotomous variable, coded 0 for female and 1 for male. Marital status was also a dichotomous variable coded 0 = Not married and 1 = Married, as was race/ethnicity, where participants were coded 0 = Non-White or other race/ethnicity and 1 = Non-Hispanic White. Educational attainment was a dichotomous variable indicating whether a participant held a bachelor’s degree or higher, coded 0 = No and 1 = Yes.
Household income was an ordinal variable with eight categories: 1 = Less than $50,000, 2 = $50,000–$74,999, 3 = $75,000–$99,999, 4 = $100,000–$149,999, 5 = $150,000–$199,999, 6 = $200,000–$249,999, 7 = $250,000–$299,999, and 8 = $300,000 or more. The variable was used to categorize household financial capacity. Similarly, net worth was an ordinal variable with 10 categories: 1 = Less than $0 (negative), 2 = $0–$5,000, 3 = $5,001–$10,000, 4 = $10,001–$25,000, 5 = $25,001–$50,000, 6 = $50,001–$100,000, 7 = $100,001–$250,000, 8 = $250,001–$500,000,
9 = $500,001–$1,000,000, and 10 = More than $1 million. Net worth calculations excluded the value of primary residences and associated mortgages up to the value of the home. Employment status was a dichotomous variable indicating whether the participant worked full-time, coded 0 = No and 1 = Yes.
Data Analysis
A general linear model (GLM) framework was employed to investigate the relationships between self-reported FRT and investment behaviors. GLM is a flexible extension of traditional ANOVA and regression techniques that allows for the simultaneous modeling of continuous dependent variables as a function of categorical and continuous predictors. In this study, several GLM analyses were conducted: one with portfolio allocation composition as the dependent variable and three with the estimates of portfolio risk as the dependent variable.
The primary fixed factor in all the models was the 11-point SCF FRT scale, which represents intervals of self-reported willingness to take financial risks. Covariates included the following demographic and socioeconomic characteristics: age, gender, marital status, race/ethnicity, educational attainment, household income, net worth, and full-time employment status. These covariates were included to control for differences in financial capacity and sociodemographic factors that may be independently associated with investing behaviors.
For each GLM, the Type III sums of squares method was used to estimate the unique contribution of each independent variable after adjusting for the other variables in the model. This approach enabled an assessment of the independent effect of risk tolerance on portfolio outcomes, while controlling for potential confounders. Model fit was evaluated using F-tests for each effect and overall model significance. Effect sizes were interpreted in terms of explained variance (R² and adjusted R²). Post hoc inspection of descriptive statistics and estimated marginal means supported the interpretation of the direction and magnitude of differences in portfolio allocation composition and risk across SCF risk tolerance categories.
Results
Sample and Variables
The profile of participants was diverse. The mean age was 43.81 years (SD = 13.75). Slightly more than 60 percent of the sample consisted of males, with nearly 74 percent of participants indicating that they were married at the time of the survey. The majority of participants were non-Hispanic White (71 percent). Educational attainment was coded as bachelor’s degree or higher, with approximately 76 percent of participants meeting this criterion. Household income was categorized into eight brackets, with most participants falling into the $200,000 or higher range. Net worth was classified into 10 categories, ranging from a negative net worth to over $1 million, with approximately 20 percent of participants reporting a net worth exceeding $1 million. Employment status was coded dichotomously as full-time work, with 73.1 percent of participants reporting full-time employment.
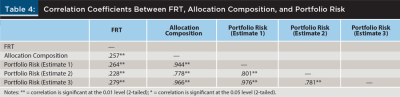
Table 3 presents the non-parametric correlations across the covariates used in this study. This analysis provided a preliminary assessment of the relationships between the demographic and socioeconomic factors prior to their inclusion in the multivariate models. As expected, correlations were significant in the majority of cases, but the effects were small to modest in size.

Table 4 presents the Pearson correlation coefficients between FRT and allocation composition, as well as the three portfolio risk estimates. This analysis offered an initial bivariate perspective on the strength and direction of variable associations. The relationships between FRT and portfolio allocation composition, as well as portfolio risk, were positive and statistically significant.
Portfolio Allocation Composition
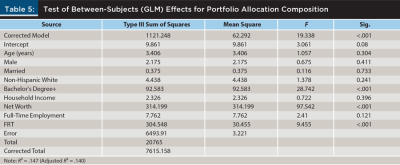
Table 5 shows the results from the first GLM. The model shows that portfolio allocation composition, operationalized as the summed count of “yes” responses to holding various investments, varied significantly by responses to the SCF risk-tolerance question, even after controlling for demographic and socioeconomic covariates. The model was statistically significant, F18, 2016 = 16.81, p < .001, with an R² of .147 (adjusted R² = .140), indicating that approximately 14 percent of the variance in allocation composition was explained by the fixed factor (FRT) and the covariates.
Descriptive patterns showed a clear, monotonic relationship between self-reported risk tolerance and portfolio allocation composition. As shown in table 6, participants with the fewest investment holdings had the lowest FRT scores, whereas those holding more types of investments had higher FRT scores.

Among the covariates, educational attainment (i.e., bachelor’s degree or higher) and net worth emerged as significant descriptors of allocation composition. Holding a bachelor’s degree or higher level of education was associated with holding a greater breadth of investments, F1, 2016 = 28.74, p < .001. This finding aligns with what has generally been reported in the literature, namely that financial literacy and human capital facilitate more complex investment strategies (Thomas and Spataro 2018). Net worth was the strongest factor in the model, F1, 2016 = 97.54, p < .001. This finding highlights the importance of financial capacity when describing allocation composition. The other demographic controls were not significant after accounting for education, net worth, and risk tolerance.
The main effect of FRT was statistically significant, F10, 2016 = 9.46, p < .001. This finding confirms that an investor’s FRT is independently associated with allocation composition above and beyond socioeconomic resources. These results reinforce the conceptual distinction between FRT (a psychological willingness to bear risk) and risk capacity (financial ability to take risk). In this model, both dimensions contributed to explaining the number of investments held in portfolios.
Portfolio Risk
Table 7 shows the results from the second GLM estimation related to the initial evaluation of portfolio risk. The model was statistically significant, F18, 2016 = 20.61, p < .001, explaining 13.4 percent of the variance in portfolio risk (R² = .134; adjusted R² = .126). The results indicate that portfolio risk varied systematically across the FRT categories, controlling for demographic and socioeconomic covariates.

The descriptive model statistics shown in table 8 revealed an increase in portfolio risk that aligned with FRT. The lowest FRT categories reported the least risky portfolios (FRT = 0, M = 6.66, SD = 4.53), while the two highest FRT categories were associated with substantially higher portfolio risk scores (FRT = 9, M = 14.53, SD = 10.28 and FRT = 10, M = 13.07, SD = 10.24, respectively). The upward trend in scores suggests a behavioral alignment between stated willingness to take financial risks and actual portfolio riskiness.

Among the covariates, net worth emerged as the strongest descriptor of portfolio risk, F1, 2016 = 76.96, p < .001, underscoring the notion that financial capacity enables higher-risk allocations. Educational attainment (i.e., holding a bachelor’s degree or higher level of education) was also significant, F1, 2016 = 13.98, p < .001. This result suggests that human capital does enhance an investor’s comfort with, or ability to manage, riskier portfolios. Age was positively associated with portfolio risk, F1, 2016 = 15.34, p < .001. The other demographic factors were not significant in the model.
The main effect of FRT was statistically significant, F10, 2016 = 8.59, p < .001, indicating that risk tolerance is a significant descriptor of portfolio risk, even after accounting for wealth, education, and other demographic characteristics. Similar to what was observed in the allocation composition model, this insight reinforces the conceptual distinction between FRT and risk capacity. While greater wealth enables someone to increase exposure to risky assets, psychological willingness to bear risk appears to exert its own, separate influence on portfolio riskiness. Taken together, the findings highlight the notion that ability (as measured by net worth and education) and willingness (as measured by FRT) can be used to describe the level of portfolio risk in investor portfolios.
Table 9 shows the GLM estimation results from the second estimate of portfolio risk. In this model, the dependent variable was the weighted score for bonds, stocks, and cryptocurrencies. The model was statistically significant, F18, 2016 = 10.55, p < .001. The model explained approximately 11 percent of the variance in portfolio risk scores (R² = .113; adjusted R² = .105). Portfolio risk varied consistently across FRT categories, controlling for demographic and socioeconomic covariates.

Similar to the first portfolio risk model, an upward trend in portfolio risk was observed with FRT. As shown in table 10, those in the lowest FRT group held the least risky portfolios (FRT = 0, M = 1.09, SD = 1.61). In contrast, those in the two highest FRT groups held riskier portfolios (FRT = 9, M = 3.19, SD = 2.33 and FRT = 10, M = 2.94, SD = 2.21, respectively).

In this model, net worth was positively associated with portfolio risk, F1, 2016 = 62.72, p < .001, as was educational attainment, F1, 2016 = 10.92, p < .001. Similarly, household income was positively associated with portfolio risk, F1, 2016 = 13.88, p < .001. Identifying as non-Hispanic White (F1, 2016 = 12.84, p < .001) and working full-time (F1, 2016 = 11.99, p < .001) were also associated with taking more portfolio risk. The other demographic factors were not significant in the model. The main effect of FRT was statistically significant, F10, 2016 = 6.37, p < .001. This finding provides support for the concept that FRT is associated with portfolio risk, even when risk is measured in a constrained manner.
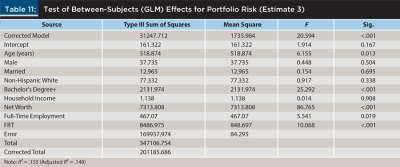
Table 11 shows the final GLM model. The dependent variable represents modified Herfindahl-Hirschman Index (HHI) scores. The model was statistically significant, F18, 2016 = 24.89, p < .001, with an R² of .155 (adjusted R² = .148). As was the case with the other models, portfolio risk varied consistently across FRT categories, controlling for other factors.
Portfolio risk patterns showed an upward monotonic relationship with FRT. As shown in table 12, participants in the lowest FRT categories were observed to hold the least risky portfolios. Those at the two highest levels of FRT held portfolios with the highest risk (FRT = 9, M = 13.01, SD = 11.79 and FRT = 10, M = 11.12, SD = 11.90, respectively).

Among the covariates, age was positively associated with portfolio risk, F1, 2016 = 6.16, p = .013. Holding a bachelor’s degree or higher level of education was also associated with portfolio risk, F1, 2016 = 25.29, p < .001, as was working full-time, F1, 2016 = 5.54, p = .019. Similar to the other models, net worth was significant in the model, F1, 2016 = 86.77, p < .001. Taken together, these findings suggest that financial capacity and human capital are useful descriptors of financial risk-taking.
In alignment with the other models, the main effect of FRT was statistically significant, F10, 2016 = 10.07, p < .001. This finding confirms that an investor’s FRT is independently associated with the degree of risk taken in their portfolio above and beyond other investor characteristics. As with the allocation composition model, this finding highlights the conceptual distinction between FRT (a person’s psychological willingness to bear risk) and risk capacity (the financial ability to take risk). In this model, both dimensions helped to describe portfolio risk.
Discussion
The GLM analyses were used to examine two distinct behavioral investment outcomes (i.e., portfolio allocation composition and portfolio risk) as a function of self-reported risk tolerance, measured using the SCF single-item risk-tolerance scale question. The models controlled for commonly utilized demographic and socioeconomic variables. Across all the models, FRT emerged as a significant and independent descriptor of allocation composition and portfolio risk.
Descriptive patterns revealed a consistent, monotonic relationship between FRT and allocation composition, as well as portfolio risk. When describing the number of different investment vehicles held in portfolios, the mean number increased from 1.25 in the lowest FRT group to over 3.00 in the highest FRT group. For portfolio risk derived from the first estimate, mean scores rose from 7.91 to over 16.00 across the same FRT categories. In the HHI model, those with the lowest FRT scores were found to have the lowest portfolio risk (1.83), whereas those at the upper end of the FRT scale were found to take more risk (11.00+). Findings suggest that a willingness to take investment risks is associated with broader investment exposure and higher portfolio risk levels.
When the models are viewed in combination, findings can be used to answer the research questions presented at the outset of this paper. First, self-reported financial risk tolerance can be used to describe the breadth of portfolio allocation composition, even after controlling for wealth, education, and other demographic factors. Second, FRT is significantly associated with overall portfolio risk, independent of financial capacity and investor characteristics. Higher-risk-tolerant investors were found to allocate larger proportions of their portfolios to higher-risk assets, resulting in greater overall portfolio risk. This finding confirms that a person’s willingness to bear risk has tangible behavioral consequences beyond owning a variety of investments. And third, among the covariates, net worth and educational attainment exert the strongest independent effects on portfolio outcomes. Age, gender, marital status, and income have smaller or non-significant effects. These findings indicate that while financial capacity does describe investment behavior, psychological risk tolerance remains an important descriptor of allocation composition and portfolio risk. Overall, the results of this study indicate that ability (wealth and education) and willingness (risk tolerance) jointly describe investment behavior. The parallel findings for allocation composition and portfolio risk suggest that measuring risk tolerance with a simple, single-item question may be sufficient to capture someone’s general psychological orientation toward risk. In alignment with Kim et al. (2021), the consistent stepwise behavioral differences across FRT categories provide further evidence of validity for the SCF scale and reinforce its utility in research and applied financial planning contexts.
Study Limitations
Despite the significant associations observed between self-reported FRT and portfolio behaviors and outcomes, several limitations warrant consideration. First, the study relied on a cross-sectional design, which precludes causal inferences. While higher self-reported risk tolerance was associated with broader investment holdings, it was not possible to determine whether risk tolerance drives portfolio choices or whether engagement with diverse investment products reinforces perceptions of one’s own risk tolerance.
Additionally, the use of a single-item self-reported measure introduced potential biases. Although the SCF FRT scale demonstrated face validity through its graded relationship with portfolio allocation composition, participants may have overstated or understated their willingness to take risks due to social desirability or recall biases (Grable et al. 2009; Jain and Kesari 2022). The item does not capture all aspects of risk attitude. Future research should consider using multidimensional questionnaires and tests for comparison. Similarly, portfolio data were based on a participant’s self-report rather than verified brokerage records, which may have affected the accuracy of the outcome. Additionally, the sample was deliberately weighted toward high-income and high-net-worth investors, which limits generalizability to similar investors. While this design approach enabled a detailed analysis of financially sophisticated individuals, the findings may not be applicable to lower-income or less financially experienced populations, which may exhibit different patterns of risk tolerance and portfolio behavior.
Another limitation is that unmeasured factors, such as behavioral biases, financial literacy beyond formal education, and access to professional advisory services, may have influenced portfolio composition independently of risk tolerance, potentially confounding the observed associations (see Pan and Statman 2012). Finally, the categorical coding of investment vehicles and the assignment of risk weights, while conceptually justified, may have oversimplified the actual risk-return characteristics of the financial instruments. Future studies should aim to determine the percentage held in various investment vehicles. Doing so will allow for a more precise estimate of portfolio risk. As a result, it should be understood that the composite portfolio risk scores described in this study provide an approximation rather than a precise measure of portfolio volatility. Future research would benefit from longitudinal designs, verified transaction data, and broader population samples to further validate and extend these findings.
Conclusion and Implications
The results from this study have implications for practice and policy. From a financial advisory standpoint, the results highlight the importance of formally assessing risk tolerance, rather than merely inferring someone’s willingness to take risks from wealth or demographic profiles, when constructing portfolios (Sages and Grable 2010). The stepwise increases in the number of investment vehicles held in portfolios and portfolio risk across levels of FRT suggest that financial advisers who fail to capture a client’s psychological willingness to take risk may misalign investment recommendations, either underexposing high-tolerance clients to growth opportunities or overexposing low-tolerance clients to excess volatility. Incorporating validated measures of FRT into the client onboarding process is not only a legal requirement but also a practical way to enhance suitability assessments, improve client–adviser trust, and help document regulatory compliance with KYC standards (Brayman et al. 2017; Grable et al. 2020).
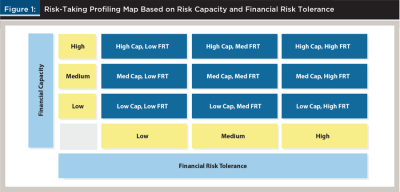
In terms of practice management, the dual effect of risk-taking capacity (i.e., wealth and education) and willingness to take risk (FRT) on investment behaviors highlights the need for more nuanced client segmentation. Financial advisers could use joint profiling by mapping clients along capacity and tolerance dimensions as shown in figure 1. Creating a profiling map could facilitate tailored client communications, portfolio modeling, and educational interventions. For instance, clients with a high willingness but low capacity to take risks may require targeted education on liquidity constraints and risk budgeting. In contrast, those with high capacity but low willingness may benefit from behavioral coaching to reduce underinvestment in growth assets. Such segmentation can also inform resource allocations within a firm, directing more time-intensive planning services toward clients whose risk-taking profiles indicate higher behavioral risk of deviating from agreed-upon strategies (i.e., those at the corner extremes in figure 1).
From a policy perspective, findings contribute to ongoing discussions about the adequacy of current investor profiling systems, such as the way the SEC defines accredited investors (Adler et al. 2021). Results from this study suggest that risk tolerance should be considered along with income and wealth. The fact that risk tolerance was independently associated with allocation composition choices and the riskiness of household portfolios suggests that capacity-based thresholds (i.e., income and net worth) may not fully capture an investor’s propensity to engage with complex or high-risk assets. Policymakers should consider integrating behavioral measures of risk tolerance into regulatory frameworks to more precisely identify investors who may require additional protections or disclosures. Additionally, the observed role of education supports initiatives aimed at expanding financial literacy, not only to improve market participation but also to promote portfolio strategies that align with both willingness and capacity to bear risk.
Citation
Grable, John, and Swarn Chatterjee. 2026. “From Risk Tolerance to Portfolio Choice: Insights from a Targeted High-Income Sample.” Journal of Financial Planning 39 (1): 60–79.
Endnotes
- See https://fastercapital.com/content/Investment-Risk-Scoring--How-to-Use-Investment-Risk-Scoring-Systems-and-Tools-to-Rank-and-Compare-Investments.html; https://community.morningstar.com/s/article/What-do-you-mean-by-the-Morningstar-Portfolio-Risk-Score; and www.captrust.com/wp-content/uploads/2024/12/Investment-Policy-Monitoring-Methodology-NQ-Version-12.31.2024.pdf.
- See www.northwesternmutual.com/life-and-money/guide-to-asset-classes-by-risk/ and https://select.axa-im.com/investment-basics/new-to-investing/articles/asset-classes.
- See Damodaran, A. 2025. Historical Returns on Stocks, Bonds and Bills: 1928–2024. NYU Stern. https://pages.stern.nyu.edu/~adamodar/New_Home_Page/datafile/histretSP.html; Nesbitt, S. L. 2022, July. “Long-term Private Equity Performance: 2000 to 2021.” CAIA.org. https://caia.org/blog/2022/07/20/long-term-private-equity-performance-2000-2021; Blanchett, D., and J. Stempien. 2024, July. “Commodities for the Long Run?” CFA Institute. https://blogs.cfainstitute.org/investor/2024/07/08/commodities-for-the-long-run/; and Jacobs, J. 2024, July. “Bitcoin Volatility Guide: Trends and Insights for Investors.” iShares. www.ishares.com/us/insights/bitcoin-volatility-trends.
References
Adler, Stuart, Joshua I. Greenberg, William G. LeBas, and Elizabeth Fleishhacker. 2021. “US Securities and Exchange Commission (SEC) Expands Accredited Investor Definition.” Journal of Investment Compliance 22 (1): 29–33.
Aggarwal, Pankaj. 2025. “An Empirical Analysis of Financial Risk Tolerance and Risk Capacity with Respect to Investment Strategies.” Economic Sciences 25 (1). https://eco-sci.org/uploads/archives/5330d8df-89a0–4a66-b2ac-4b04c78d5655.pdf.
Anbar, Adem, and Melek Eker. 2010. “An Empirical Investigation for Determining the Relation Between Personal Financial Risk Tolerance and Demographic Characteristic.” Ege Akademik Bakis Dergisi 10: 503–22.
Borrelli, Lisa, and Paul Villanova. 2025. “Risk Capacity vs. Risk Tolerance: What’s the Difference?” SmartAsset Blog. https://smartasset.com/investing/risk-capacity-vs-risk-tolerance.
Brayman, Shawn, John E. Grable, Paul Griffin, and Michael Finke. 2017. “Assessing a Client’s Risk Profile: A Review of Solution Providers.” Journal of Financial Service Professionals 71 (1): 71–81.
Brezina, Ivan, Juraj Pekár, Zuzana Čičková, and Marian Reiff. 2016. “Herfindahl–Hirschman Index Level of Concentration Values Modification and Analysis of Their Change.” Central European Journal of Operations Research 24 (1): 49–72.
Brooks, Chris, Ivan Sangiorgi, Carola Hillenbrand, and Kevin Money. 2019. “Why Are Older Investors Less Willing to Take Financial Risk?” International Review of Financial Analysis 56: 52–72.
Bruder, Benjamin, Nazar Kostyuchyk, and Thierry Roncalli. 2022. “Risk Parity Portfolios with Skewness Risk: An Application to Factor Investing and Alternative Risk Premia.” arXiv preprint arXiv:2202.10721.
Chang, Chih-Chen, Sharon A. DeVaney, and Sherman T. Chiremba. 2004. “Determinants of Subjective and Objective Risk Tolerance.” Journal of Personal Finance 3 (3): 53–67.
Chavali, Kavita, and M. Mohanraj. 2016. “Impact of Demographic Variables and Risk Tolerance on Investment Decisions: An Empirical Analysis.” International Journal of Economics and Financial Issues 6: 169–75.
Cordell, David M. 2002. “Risk Tolerance in Two Dimensions.” Journal of Financial Planning 15 (5): 30–36.
Corter, James E., and Yan-Jiang Chen. 2006. “Do Investment Risk Tolerance Attitudes Predict Portfolio Risk?” Journal of Business and Psychology 20 (3): 369.
Crockett, Jean, and Irwin Friend. 1967. “Consumer Investment Behavior.” In Determinants of Investment Behavior. NBER: 15–127.
Ferreira, Sune, and Zandri Dickason-Koekemoer. 2020. “A Structural Equation Model of Financial Risk Tolerance in South Africa.” Cogent Business and Management 7 (1): 1811595.
Fisher, Patti. 2019. “Black-White Differences in Financial Risk Tolerance.” Journal of Financial Service Professionals 73 (4): 70–82.
Gibson, Rajna J., David Michayluk, and Gerhard Van de Venter. 2013. “Financial Risk Tolerance: An Analysis of Unexplored Factors.” Financial Services Review 22: 23–50.
Goetzmann, William N., and Alok Kumar. 2008. “Equity Portfolio Diversification.” Review of Finance 12 (3): 433–63.
Gondaliya, Vijay, and Girish Dhinaiya. “Assessing Financial Risk Tolerance: Do Demographic, Socioeconomic and Attitudinal Factors Work?” International Journal of Marketing and Financial Management 4 (5): 32–38.
Grable, John E. 2000. “Financial Risk Tolerance and Additional Factors That Affect Risk Taking in Everyday Money Matters.” Journal of Business and Psychology 14: 625–30.
Grable, John, Amy Hubble, and Michelle Kruger. 2020. “Do as I Say, Not as I Do: An Analysis of Portfolio Development Recommendations Made by Financial Advisors.” The Journal of Wealth Management 22 (4): 62–73.
Grable, John E., and Ruth H. Lytton. 2001. “Assessing the Concurrent Validity of the SCF Risk Tolerance Question.” Journal of Financial Counseling and Planning 12 (2): 43–53.
Grable, John E., Sean McGill, and Sonya L. Britt. 2009. “Risk Tolerance Estimation Bias: The Age Effect.” Journal of Business and Economics Research 7 (7): 1–12.
Grable, John E., and Michael J. Roszkowski. 2007. “Self-Assessment of Risk Tolerance by Women and Men.” Psychological Reports 100: 795–802.
Grable, John E., and Lance Palmer. 2024. Introduction to Personal Finance: Beginning Your Financial Journey. John Wiley & Sons.
Grable, John E., and Walter Schumm. 2010. “An Estimate of the Reliability of the Survey of Consumer Finances Risk-Tolerance Question.” Journal of Personal Finance 9 (1): 117–131.
Hallahan, Terrence A., Robert W. Faff, and Michael D. McKenzie. 2004. “An Empirical Investigation of Personal Financial Risk Tolerance.” Financial Services Review 13: 57–78.
Heo, Wookjae, Lilian H. N. Nobre, John E. Grable, and Jorge Ruiz-Menjivar. 2016. “What Role Does Financial Risk Tolerance Play in Mediating Investing Behavior?” Journal of Financial Service Professionals 70 (5): 42–52.
Investopedia. 2023, March 7. “Determining Risk and the Risk Pyramid.” www.investopedia.com/articles/basics/03/050203.asp.
Jain, Nikhil, and Bhawna Kesari. 2022. “The Impact of Behavioral Biases on Financial Risk Tolerance of Investors and Their Decision Making.” Master’s thesis, University of Delhi.
Kim, Kyung Tae, Sherman D. Hanna, and Dongyue Ying. 2021. “The Risk Tolerance Measure in the 2016 Survey of Consumer Finances: New, But Is It Improved?” Journal of Financial Counseling and Planning 32 (1): 1–28.
Kruger, Michelle, John E. Grable, and Sarah Fallaw. 2017. “An Evaluation of the Risk-Taking Characteristics of Affluent Households.” Journal of Financial Planning 30 (7): 38–47.
Kuzniak, Stephen, and John Grable. 2017. “Does Financial Risk Tolerance Change Over Time? A Test of the Role Macroeconomic, Biopsychosocial and Environmental, and Social Support Factors Play in Shaping Changes in Risk Attitudes.” Financial Services Review 26 (4): 315–38.
Kwak, E. J., and John E. Grable. 2024. “A Comparison of Financial Risk-Tolerance Assessment Methods in Predicting Subsequent Risk Tolerance and Future Portfolio Choices.” Risks 12 (11): 170.
Larkin, Charles, Brian M. Lucey, and Michael Mulholland. 2013. “Risk Tolerance and Demographic Characteristics: Preliminary Irish Evidence.” Financial Services Review 22: 77–91.
Lee, So-Yeon. 2011. “Why the Accredited Investor Standard Fails the Average Investor.” Review of Banking and Financial Law 31: 987–1008.
Makarov, Dmitry, and Anita V. Schornick. 2010. “Explaining Households’ Investment Behavior.” INSEAD Working Paper No. 2010/44/FIN. https://papers.ssrn.com/sol3/papers.cfm?abstract_id=1623785.
Markowitz, Harry M. 1952. “Portfolio Selection.” The Journal of Finance 7 (1): 71–91.
Modigliani, Franco, and Modigliani Leah. 1997. “Risk-Adjusted Performance.” Journal of Portfolio Management 23 (2): 45–54.
Nosita, Fenny, Kashan Pirzada, Titi Lestari, and Rudi Cahyono. 2020. “Impact of Demographic Factors on Risk Tolerance.” Journal of Security and Sustainability Issues 9 (4): 1327–36.
Pan, Carrie H., and Meir Statman. 2012. “Questionnaires of Risk Tolerance, Regret, Overconfidence, and Other Investor Propensities.” Journal of Investment Consulting 13 (1): 54–63.
Park, Eric, and Rui Yao. 2016. “Financial Risk Attitude and Behavior: Do Planners Help Increase Consistency?” Journal of Family and Economic Issues 37 (4): 624–638.
Pedersen, Niels, Sébastien Page, and Fei He. 2014. “Asset Allocation: Risk Models for Alternative Investments.” Financial Analysts Journal 70 (3): 34–45.
Pinjisakikool, Thanchanok. 2017. “The Influence of Personality Traits on Households’ Financial Risk Tolerance and Financial Behavior.” Journal of Interdisciplinary Economics 30: 32–54.
Rabbani, A. G., and Leanne H. Nobre. 2022. “Financial Risk Tolerance”. In DeGruyter Handbook of Personal Finance. Edited by J. E. Grable and S. Chatterjee. Berlin: De Gruyter: 137–56.
Sages, Ronald A., and John E. Grable. 2010. “Financial Numeracy, Net Worth, and Financial Management Skills: Client Characteristics That Differ Based on Financial Risk Tolerance.” Journal of Financial Service Professionals 64 (6): 57–65.
Securities and Exchange Commission. n.d. “Accredited Investors.” Accessed September 5, 2025. www.sec.gov/resources-small-businesses/capital-raising-building-blocks/accredited-investors.
Statman, M. 2004. “The Diversification Puzzle.” Financial Analysts Journal 60 (4): 44–53.
Sung, Jaimie, and Sherman D. Hanna. 1996. “Factors Related to Risk Tolerance.” Journal of Financial Counseling and Planning 7: 11–20.
Tahvildari, Mohammad. 2025. “Analysis of Investor Profiling and Portfolio Recommendations by Robo-Advisors in Germany.” Global Business and Finance Review 30 (8): 19–33.
Thomas, Anna, and Luca Spataro. 2018. “Financial Literacy, Human Capital and Stock Market Participation in Europe.” Journal of Family and Economic Issues 39 (4): 532–50.
Varley, L. 2007. “Response to Request for Information Regarding Computer Models for the Provision of Investment Advice to Individual Retirement Accounts.” https://www.dol.gov/sites/dolgov/files/EBSA/ laws-and-regulations/rules-and-regulations/public-comments/investment-advice/00019.pdf.
Wagner, Wayne H., and Sheila C. Lau. 1971. “The Effect of Diversification on Risk.” Financial Analysts Journal 27 (6): 48–53.
Woerheide, Walt, and Don Persson. 1992. “An Index of Portfolio Diversification.” Financial Services Review 2 (2): 73–85.
Wong, Alan. 2011. “Financial Risk Tolerance and Selected Demographic Factors: A Comparative Study in 3 Countries.” Global Journal of Finance and Banking Issues 5 (5): 1–12.
Yao, Rui, Deanna L. Sharpe, and Feifei Wang. 2011. “Decomposing the Age Effect on Risk Tolerance.” The Journal of Socio-Economics 40: 879–87.
Yao, Zheying, and Abed G. Rabbani. 2021. “Association Between Investment Risk Tolerance and Portfolio Risk: The Role of Confidence Level.” Journal of Behavioral and Experimental Finance 30: 100482.