Journal of Financial Planning: April 2023
Executive Summary
- Prior research shows that during periods of high market volatility, investors tend to shift wealth from risky to safe assets.
- This research examines the behavior of registered investment advisers (RIAs) and their clients during the 2020 market downturn due to the COVID-19 pandemic, specifically exploring portfolio management decisions during this period.
- The authors of this study find that RIAs provided value to their clients during the COVID-19 market crash, using effective buy/sell strategies.
- This study also investigates the use of Twitter as a means of communication with prospective and existing clients. The authors discuss how financial advisers can benefit from continuing education resources around managing investor behavior online when so many rely on social media.
- Financial planning stakeholders, specifically RIA firms, organizations such as the Financial Planning Association, and the Certified Financial Planner Board of Standards, would serve their members well by utilizing more aggressive public campaigns to promote awareness of the value associated with working with financial advisers.
- Additionally, regulatory bodies and compliance departments should consider providing financial advisers and marketing departments with greater flexibility around the use of social media as a tool to educate and disseminate information during periods of high market volatility.
Yuanshan Cheng, Ph.D., CFP®, CFA, is the director of financial planning research at Morningstar Inc. His research interests include multiperiod optimization of decumulating strategies, best practices in financial planning, and the value of financial advisers.
Tao Guo, Ph.D., CFP®, CFA, is the director of retirement research at Morningstar Investment Management. His research interests include robo-advisory, retirement income management, and lifetime income solutions.
Philip Gibson, Ph.D., CFP®, is a professor of finance and director of financial planning at Winthrop University. His research interests include portfolio management and retirement wellness.
Janine Sam, Ph.D., CFP®, is a financial planner with Empower, providing comprehensive financial planning to Empower clients across all market segments. Over the past decade, Janine has primarily taught financial planning courses at the university level in the United States and abroad in New Zealand. She has worked with legislators abroad to bring greater awareness to the CFP® designation. Her research includes retirement planning, risk management, and financial literacy.=
NOTE: Click on the images below for PDF versions
The public health crisis from COVID-19 significantly impacted business activities and household finances and created financial market volatility. These adverse events led to government intervention in the form of lockdowns and innovative financial relief programs. With the sudden disruption to economic activities, the U.S. financial market experienced a significant decline in March 2020 but quickly rebounded within the next two months. Since many investors are loss averse (Kahneman and Tversky 1979) when participating in the stock market, the COVID-19 recession provides a unique opportunity to examine the proactive and/or reactive measures implemented by registered investment advisers (RIAs). Furthermore, it may be helpful to various financial planning stakeholders to explore and assess whether RIAs provided value in portfolio management during this period of volatility and uncertainty, as well as the messaging communicated to the public. This study is the first to address this topic using data from 13F filings, ADV forms, and tweets from investment adviser representatives (IARs) at RIA firms. When communicating with clients, we find that RIAs communicated frequently and positively using tweets, especially during extremely negative return days. Furthermore, we show that clients with discretionary accounts sold less and bought more during the market downturn than those with nondiscretionary accounts. Therefore, our research provides empirical evidence that RIAs provided value to their clients during the COVID-19 market crash via portfolio management. We also found financial advisers utilized social media to convey positive financial information to both potential and current clients.
Literature Review
Shiller (1987) was among the first researchers to identify how investors behave during a stock market crash. He cited numerous ways individuals responded to a market crash and noted that many investors believed they could predict the market. Empirical evidence shows that a typical investment mistake is a behavioral tendency to shift wealth from risky to safe assets during volatile and declining markets (Ben-Rephael, Kandel, and Wohl 2012; Freisen and Sapp 2007). While a rebound eventually follows a market crash, the timing is unknown. Ciccone (2018) examined and analyzed the five most recent financial market crises and provided evidence that investors who stay in the market during a financial crisis were better off because the recovery returns tend to be abnormally high, rewarding those who remained invested.
The Demand for Registered Investment Advisers
Various studies have explored how well households manage their finances with the increased usage of defined contribution plans. Campbell, Jackson, Madrian, and Tufano (2011) argued that the financial system is difficult to understand and navigate, and it may not be efficient nor effective in the long run for consumers to learn personal finance through trial and error. Benartzi, Previtero, and Thaler (2011) demonstrated that individuals have difficulty determining how much money to spend each year in retirement due to the complexity associated with decumulation decisions. Thus, it is rational and beneficial to seek financial planning experts to aid in meeting household financial planning needs.
The value of RIAs is well documented. Marsden, Zick, and Mayer (2011) showed that individuals who worked with financial advisers were more likely to make critical financial decisions such as setting goals, establishing emergency funds, calculating retirement needs and having retirement confidence, diversifying retirement accounts, using supplemental retirement accounts, and having positive behavioral responses to economic crises. Likewise, Moreland (2018) provided evidence that obtaining financial advice is positively associated with many positive financial behaviors. Hung and Yoong (2013) highlighted that financial advice could improve investment behavior. More recently, Blanchett (2019) found that households using a financial planner make better financial decisions than those relying on the internet or working with a transactional adviser. Furthermore, financial advisers can help clients in retirement identify reasonable withdrawal rates (Bengen 1994; Finke, Pfau, and Blanchett 2013) using dynamic analysis (Guyton and Klinger 2006) to help with portfolio sustainability.
The loss aversion theory by Tversky and Kahneman (1974) states that people experience more discomfort from losses than pleasure from equivalent gains, leading them to be more likely to avoid a set number of losses than take an equal chance of getting the same number of gains. Thus, a significant decline in wealth during a financial market downturn may trigger fear, dissatisfaction, and the desire to overreact. While we cannot capture fear or discontent among clients due to data limitations, we expect less of an overreaction among those working with a financial adviser.
The COVID-19 Pandemic and Financial Markets
The onset of the COVID-19 pandemic produced the most extreme changes in U.S. stock prices over 22 trading days (in late February and March 2020) than at any other time in history (Baker et al. 2020). The 34 percent drop in the S&P 500 index between February 19 and March 23, following a spike in volatility and a sharp decline in asset prices, presents a unique opportunity for researchers to study investor behavior. Giglio, Maggiori, Stroebel, and Utkus (2020) used a customized survey from Vanguard to analyze investors’ expectations about economic growth and stock returns during the February to March 2020 stock market crash. The authors stated that the most optimistic investors in February had the most significant decline in expectations and sold the most equity. Blanchett, Finke, and Reuter (2020) examined the likelihood of investment allocation changes by 401(k) plan participants during the first quarter of 2020. Based on their observation, the authors suggested that portfolio delegation through target date funds or managed accounts could decrease the likelihood of making portfolio mistakes as only 2.1 percent of participants invested in TDFs made changes in their portfolio, with fewer making changes in robo-advised managed accounts.
Data and Methods
The data for this study comes from 13F filings, Form ADV, and Twitter. To create the dataset, we downloaded 13F data from SEC EDGAR from the first and second quarter of 2020. Additionally, we downloaded 5,401 unique companies identified by the Central Index Key (CIK) in the first quarter of 2020 and 5,360 from the second quarter of 2020. The original 13F data contains variables including CIK; reporting period; company name; report type; classification; name of the issuer; title of the class; CUSIP; value; share amount; share type; investment discretion; voting-right: sole, shared, or none; scrap URLs; conformed name; business address of street, city, state, zip, and phone; and IRS number. Since companies have more than one holding, the original sample for the data was 2,058,668 rows from the first quarter and 2,028,560 from the second quarter of 2020. After downloading the 13F forms in text format, we parsed the CUSIP, classification of “Investment Advice [6282]”, “share amount,” “company name” with each stock, and “investment discretion.” Within the 13F document, some companies report multiple rows of the same fund due to different share classes. Thus, for our analysis, we combined the share amounts by each fund’s CIK and CUSIP. We then matched the investment holding data with Morningstar and Bloomberg data to identify ticker names through CUSIP. With the availability of ticker names, equity styles were identified using the Morningstar Direct database. We identified 5,345 companies (CIKs) with changed share numbers that appear within both the first and second quarters of 2020.
Investment managers with institutional holdings over $100 million in assets are required to report their quarterly holdings to the Securities and Exchange Commission (SEC) by filing a Form ADV. We matched the 13F filing with Form ADV, limiting our sample to only wealth management firms. The Form ADV was directly downloaded from the SEC. We use the Form ADV Part 1 data updates reported by RIAs from July 1, 2020, to September 30, 2020. Since Form ADV does not include a company ID, we matched the two datasets by firm name. For firms not matched by name, we used the business phone numbers as the identifier. While the entire sample of ADVs consists of 16,111 firms, some firms do not need to report 13F, and therefore have been excluded from the sample. Using the previous name-matching technique, we matched 3,365 companies in the original 13F data. Furthermore, we reformatted phone numbers to do a secondary match resulting in another 427 firms. In total, the sample comprises 3,792 matched firms.
Item 5.D on Form ADV states, “For purposes of this Item 5.D, the category ‘individuals’ includes trusts, estates, and 401(k) plans and IRAs of individuals and their family members, but does not include businesses organized as sole proprietorships.” Since we are focused on individuals, we removed firms working with pensions, resulting in a final sample of 2,420 companies. Within the database, we identified the company name, CIK, CUSIP, investment discretion, the issuer’s name, changes in the number of shares for each ticker, and whether the position is new or closed, underweight or overweight. New positions were identified when a new ticker appeared in the second quarter of the data but was not apparent in the first quarter. The closed position was determined when a ticker available in the first quarter was no longer available in the second quarter. Underweight means that the number of shares decreased, while overweight implies the number of shares increased. We did not examine the dollar value of positions but only the number of shares of a specific stock/ETF.
The second part of this study analyzes tweets from advisers. Using Form ADV, we obtained the Twitter handle used by some firms. We then matched the Twitter handles to our dataset using the firm name. Tweets were downloaded from www.twitter.com based on the Twitter handle listed on the Form ADV. We limited the period from February 25, 2020, to April 29, 2020, to match the data used in the rest of this study. These dates were used for the entire analysis.
The pulled tweets were analyzed using a machine learning algorithm trained by Araci (2019). Araci (2019) provides a trained FinBert library that quantifies the sentiment level of financial news. FinBERT is a natural language processing (NLP) model that has been pre-trained to evaluate the sentiment of financial text. It was created by enhancing the Bidirectional Encoder Representations from Transformers (BERT) language model with additional training in the finance industry, using a comprehensive financial database, thereby allowing it to be specialized for classifying sentiment in financial contexts. The library contains a dictionary that breaks text data into numerical array data of 128 dimensions. Additionally, the library uses weights and the neural network structure to convert the arrays into SoftMax categories of sentiments. We chose the machine learning method instead of traditional “word counting,” which comes up short in analyzing deeper semantics (Araci 2019) or the meaning of the text. In our study, we also examined the “#cashtag” used in tweets. Many advisers frequently use “#cashtag” to reference specific tickers within their tweets. We extracted the tickers associated with “#cashtags” and matched them with their recent daily and weekly returns.
Twitter accounts are not available in the Excel file released on the SEC’s website. Therefore, we downloaded the original XML file from the SEC database and parsed out the Twitter accounts in Item 1 web addresses. While firms list multiple web addresses, such as their website, LinkedIn, and Twitter accounts, we focused only on Twitter accounts in this study. We used the TWINT package in Python, which uses bots to extract “web-scrape” tweets posted from February 25 to April 29 of 2020. We chose the period according to how the S&P 500 (and other markets) were performing and consider this to be the period when investors panicked the most. Markets after May 2020 experienced positive and relatively smooth returns.
Additionally, we downloaded the firm names from the previously matched samples and merged the firm name and Twitter account information. For our analyses, we retained only firms with Twitter accounts, and we decided to solely keep the last used account for companies with multiple Twitter accounts to avoid overweighting. Of our total sample of 2,420 firms, 291 firms actively use Twitter as a communication platform.
Results
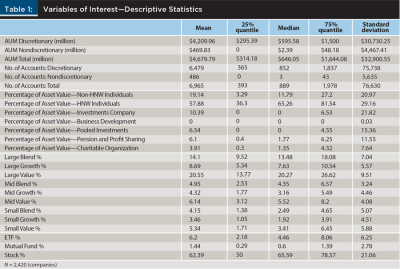
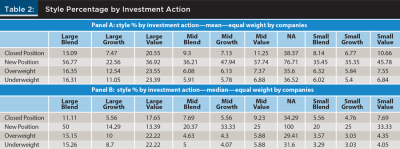
Table 1 provides the descriptive statistics of the variables used in our analysis, and it contains information on the assets under management, the percentage of high-net-worth households, and allocation to fund style. Table 2 summarizes the equity style of new and closed positions as well as underweighted or overweighted positions. In Panel A, we show the mean, and in Panel B, we report the median. Interestingly, while most firms only held exchange-traded funds (ETFs) and mutual funds, we observe that many had large positions in stocks. The median was 65 percent. It is important to note that mutual funds holdings are not required to be reported in 13F filings. See Pan, Wang, and Zykaj (2019) for required reporting.
Using ordinary least squares (OLS) regression, Table 3 shows the percentage of each company’s investment action regressed against the type of asset under management (percent). The authors differentiated the RIA firms by focusing on the type of clients served, i.e., non-high-net-worth investors, high-net-worth investors, pensions, and profit-sharing plans. As shown in the first three columns of Table 3, where the percentage of the new position is the dependent variable, it is evident that as the percentage of non-high-net-worth clients increases within the company, there is a higher chance of opening new positions. While it might not seem noteworthy to add new positions in a market downturn, the positive and significant coefficients in the second set of models (fourth to sixth columns), where the percentage of closed positions is the dependent variable, also indicate that RIA firms serving more non-high-net-worth investors are more likely to sell out (or close) positions. Thus, firms are making tactical asset allocation decisions to improve their performance and demonstrate value to their clients.
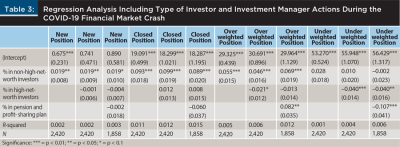
Regarding high-net-worth clients (or investment managers with a higher portion of high-net-worth clients), their portfolios were significantly less likely—statistically and economically—to underweight positions during the COVID-19 financial market crash. Compared to accounts with a higher portion of non-high-net-worth clients, those with a greater portion of high-net-worth clients seemed more passive. The coefficients of opening new positions and closing positions are not significant, leaning toward using a passive strategy. We argue that there could be two reasons for this. First, it indicates that high-net-worth clients’ portfolios had most funds invested in the financial markets before the COVID-19 financial crash. Secondly, during the COVID-19 financial market crash, these high-net-worth clients’ portfolios tend to keep their funds in the market without making withdrawals or waiting for a recovery. Furthermore, high-net-worth investors have the financial resources to withstand volatility in the market. Many might have experienced other unsettling periods in the market and are more prepared for periods of high market volatility.
Word Embedding and Transferred Learning From Tweet Sentiment
This section analyzes tweets from RIA firms during the COVID-19 financial recession. After cleaning the data, the authors relied on a deep neuro-network model called FinBERT (Araci 2019) to analyze the sentiment level of each tweet. There are multiple points to clarify in this section of the analysis. RIA firms are different from individuals who use tweets as a part of personal social media accounts. The platform mimics an RIA news source, only reporting positive news during the COVID-19 financial crisis. The benefit of using FinBERT, as illustrated by Araci (2019), is that the word embedding is trained based on financial news from Reuters, and the model itself is trained using Financial PhraseBank data. The sentiment category was manually annotated by financial professionals. Since the FinBERT model uses the BERT model from Google Brain, it is also the current state-of-the-art machine learning algorithm in the field of natural language processing.1
The summary in Table 4 shows a considerable variation in how companies use tweets. In this study, since we are collecting data over two months, our median number of tweets is 14, which means advisers usually tweet once every two trading days. Certainly, this is less than ideal for higher-quality data analysis; however, this is how advisers use the platform.

Tweets Over Time
Figures 1 and 2 indicate that RIA firms disseminated more tweets during days when the market experienced extreme volatility. During this period, advisers sent out positive news to comfort their followers. RIAs might wish to communicate with clients for numerous reasons. During periods of high financial market volatility, investors might panic and seek the help of a professional. Social media allows an adviser to remain or become visible to prospective clients. Additionally, it will enable RIAs to reach their client base sooner. It also allows the adviser to share information so that it can easily be disseminated to a wider audience.


Ticker Analysis
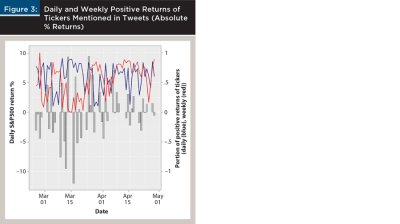
While examining the data, we observed that some tweets refer to the actual ticker of securities. We used a Python library, Reticker, to extract tickers mentioned in tweets. We subsequently analyzed the performance of these securities related to the S&P 500 daily and weekly returns to understand the type of securities highlighted by RIA firms during this period of extreme volatility.
Notably, relatively few RIA firms use Twitter accounts, and even fewer firms use tickers in tweets. As stated earlier, we identified 291 firms that used tweets out of the 2,420 firms (as identified by the package) in our sample that mentioned tickers. To be more accurate, we filtered the data further using Yahoo’s finance ticker database; we found 169 firms actively mentioned tickers. Using Yahoo Finance API, we extracted ticker names from tweets and pulled recent daily and weekly returns associated with each security. We could identify how many securities had positive daily or weekly returns out of all securities. The results are shown in Figure 3. While there was a clear challenge in finding stocks with positive daily and weekly returns during the COVID-19 financial market crash, RIA firms intentionally focused on “winners” (at least among advisers who tweet frequently). While our findings do not represent the total RIA populace, our findings highlight stocks deemed “winners” for RIA firms who mentioned tickers in tweets.
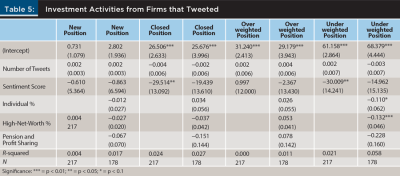
In Table 5 we examine the investment activities of the firms with affiliated tweets. While we do not observe much statistical power, the directionality of the variables tells a story. Those who tweeted were less likely to close positions during the COVID-19 lockdown, which is an indication of sticking to the plan. With regard to sentiments, those who had a more positive tone in their tweets were significantly less likely to close positions and significantly less likely to underweight positions.
Conclusion and Implications
Financial markets are cyclical, going from trough to peak over and over again. Although each recession is different, the fundamental principles behind proper portfolio management remain the same. So, while the United States has experienced numerous recessions, the 2020 COVID-19 market crisis period is the first time that financial advisers navigated through a global pandemic that led to a national shutdown of the U.S. economy. This study provides insight into how RIAs added value during this most recent stock market crash. By analyzing tweets from RIAs during this period of high market volatility, we found evidence of frequent communication among RIAs and their clients, with some firms reporting positive financial news and positive stock returns in their tweets. Additionally, by examining RIA investments from 13F filings from the first and second quarter of 2020, this study suggests that high-net-worth investors working with RIA firms (identified using ADV forms) are more likely to stick to original portfolio positions than non-high-net-worth investors working with RIAs. Consistent with prior literature, our study suggests that working with financial advisers is valuable, especially during high financial market volatility. Based on the results, it is evident that those high-net-worth individuals working with a financial adviser were more likely to stick to their investment plan.
Therefore, it is apparent that to ensure portfolio sustainability and longevity, financial advisers should be aware of financial market conditions and how to best react and communicate with clients. RIA firms, and organizations such as the Financial Planning Association and the Certified Financial Planner Board of Standards need to be more aggressive in public campaigns aiming to bring further awareness to the value of working with financial professionals. As the financial planning profession evolves, we must understand and underscore financial advisers’ value to their clients.
In financial planning, a need exists to provide ongoing education on managing investor behavior and utilizing social media tactics to impact client behavior while promoting the firm. While volatility is a natural part of the market, the magnitude and the speed at which the stock market declined in the first half of 2020 is not the norm. Undoubtedly, such a fall in the market created panic among investors. This created an opportunity for well-informed financial advisers to communicate with the masses through social media, providing education while signaling the value they can offer clients. This study also highlights implications for future research on the appropriate use of social media when communicating with clients and prospective clients. More specifically, when it comes to social media communication, questions financial advisers should consider include: (1) what are clients (and prospective clients) interested in seeing and hearing from their financial adviser, (2) what is the appropriate level of communication within various social media channels, and (3) during periods of high market volatility, how frequently should firms be communicating with clients and prospective clients? Since social media can be a useful tool for individuals seeking professional financial advice and communicating with existing financial advisers’ clients, regulatory bodies and compliance departments ought to provide financial advisers and marketing departments with greater flexibility when using social media. Consumers of financial advice need sound and ethical guidance, especially during periods of high market volatility.
Endnote
- Readers can find more information from the field of computer science via this link: https://github.com/ProsusAI/finBERT.
Citation
Cheng, Yuanshan, Tao Guo, Philip Gibson, and Janine Sam. “The Value of Registered Investment Advisers During the COVID-19 Financial Market Crash—Evidence from 13F Filings and Twitter.” Journal of Financial Planning 36 (4): 70–80.
References
Araci, D. 2019. “Financial Sentiment Analysis with Pre-trained Language Models.” arXiv preprint: arXiv:1908.10063.
Baker, S.R., N. Bloom, S.J. Davis, K.J. Kost, M.C. Sammon, and T. Viratyosin. 2020. “The Unprecedented Stock Market Impact of COVID-19.” National Bureau of Economic Research Working Paper No. w26945. www.nber.org/papers/w26945.
Benartzi, S., A. Previtero, and R. H. Thaler. 2011. “Annuitization Puzzles.” Journal of Economic Perspectives 25 (4): 143–164.
Bengen, W. P. 1994. “Determining Withdrawal Rates Using Historical Data.” Journal of Financial Planning 7 (4): 171–180.
Ben-Rephael, A., S. Kandel, and A. Wohl. 2012. “Measuring Investor Sentiment with Mutual Fund Flows.” Journal of Financial Economics 104 (2): 363–82.
Blanchett, D.M. 2019. “Financially Sound Households Use Financial Planners, Not Transactional Advisers.” Journal of Financial Planning 32 (4): 30–40.
Blanchett, D., M.S. Finke, and J. Reuter. 2020. “Portfolio Delegation and 401(k) Plan Participant Responses to COVID-19.” National Bureau of Economic Research Working Paper No. w27438. www.nber.org/papers/w27438.
Campbell, J.Y., H.E. Jackson, B.C. Madrian, and P. Tufano. 2011. “Consumer Financial Protection.” Journal of Economic Perspectives 25 (1): 91–114.
Ciccone, S. 2018. “Investing During Major Depressions, Recessions, and Crashes.” International Journal of Business Management and Commerce 3 (2): 1–6. www.ijbmcnet.com/images/Vol3No2/1.pdf.
Finke, M.S., W.D. Pfau, and D. Blanchett. 2013. “The 4 Percent Rule Is Not Safe in a Low-Yield World.” Journal of Financial Planning 26 (6): 46–55.
Friesen, G.C., and T.R. Sapp. 2007. “Mutual Fund Flows and Investor Returns: An Empirical Examination of Fund Investor Timing Ability.” Journal of Banking & Finance 31 (9): 2796–2816.
Giglio, S., M. Maggiori, J. Stroebel, and S. Utkus. 2020. “Inside the Mind of a Stock Market Crash.” National Bureau of Economic Research Working Paper No. w27272. www.nber.org/papers/w27272.
Guyton, J. T., and W. J. Klinger. 2006. “Decision Rules and Maximum Initial Withdrawal Rates.” Journal of Financial Planning 19 (3): 48.
Hung, A., and J. Yoong. 2010. “Asking For Help: Survey and Experimental Evidence on Financial Advice and Behavior Change.” RAND Corporation Labor and Population Working Paper WR-714-1. Washington, D.C. www.rand.org/pubs/working_papers/WR714-1.html.
Kahneman, D., and A. Tversky. 1979. “Prospect Theory: An Analysis of Decision under Risk.” Econometrica 47 (2): 263–292.
Marsden, M., C. D. Zick, and R. N. Mayer. 2011. “The Value of Seeking Financial Advice.” Journal of Family and Economic Issues 32 (4): 625–643.
Moreland, K.A. 2018. “Seeking Financial Advice and Other Desirable Financial Behaviors.” Journal of Financial Counseling and Planning 29 (2): 198–207.
Pan, X., K. Wang, and B. Zykaj. 2019. “Does Institutional Ownership Predict Mutual Fund Performance? An Examination of Undiscovered Holdings Within 13(F) Reports.” European Financial Management 25 (5): 1249–1285.
Shiller, R. J. 1987. “Investor Behavior in the October 1987 Stock Market Crash: Survey Evidence.” National Bureau of Economic Research Working Paper. No. 2446. www.nber.org/papers/w2446.
Tversky, A., and D. Kahneman. 1974. “Judgment Under Uncertainty: Heuristics and Biases.” Science 185 (4157): 1124–1131.