Journal of Financial Planning: February 2016
Chris Browning, Ph.D., is an assistant professor and co-director of undergraduate programs in the Department of Personal Financial Planning at Texas Tech University.
Tao Guo, Ph.D., is an assistant professor in the Department of Economics, Finance, and Global Business at William Patterson University. His research interests include retirement income strategies, household portfolio management, and financial decision-making quality.
Yuanshan Cheng is a Ph.D. candidate in the Department of Personal Financial Planning at Texas Tech University. His research interests include financial planning regulation, retirement planning strategies, and retirement well-being.
Michael S. Finke, Ph.D., CFP®, is a professor and director of the Retirement Planning and Living Consortium in the Department of Personal Financial Planning at Texas Tech University.
Acknowledgements: The authors thank the Retirement Planning and Living Consortium in the Department of Personal Financial Planning at Texas Tech University for supporting this research.
Executive Summary
- Retirement savings adequacy estimations are often based on the assumption that clients spend the same amount every year in retirement, and that the withdrawal rate to fund spending is based on spending down a percentage of retirement savings.
- The purpose of this study was to determine if, despite the possibility of low asset returns and longer lives in retirement, retirees are spending an amount that would put them in danger of running out of money.
- We simulated safe consumption rates and compared the amount that wealthy retirees are spending to the amount they could safely spend given different asset return assumptions and investment portfolio allocations.
- We followed the change in assets among retirees during the 2000s to see how much of their wealth they spent down during this period.
- Retirees in the top quintile of financial wealth were spending nowhere near an amount that would place them in danger of running out of money. In fact, the average financial assets of wealthy retirees increased during this period and most retirees spent less than their income.
- Setting aside 40 percent of financial assets to cover uncertain longevity, medical costs, and bequests still results in a consumption gap as high as 47.3 percent among higher-wealth retirees.
Much of the financial planning literature on safe withdrawal rates assumes that retirees spend a constant amount of money that is based on spending down (or decumulating) a percentage of accumulated investment assets. For example, Bengen (1994) introduced a methodology of constant inflation-adjusted spending that began at 4 percent of initial retirement savings. Cooley, Hubbard, and Walz (1998) and Guyton (2004) assumed constant real spending based on initial assets to determine how much a retiree could optimally spend each year from a portfolio of investment assets.
These simulations assume that retirees draw down their wealth in order to fund retirement spending. The economic rationale is that people save money during their working years so that they can eventually spend it. The life-cycle hypothesis (LCH) predicts that retirees will decumulate their financial assets in order to achieve a smooth consumption path in which spending after retirement is roughly equal to spending before retirement (Ando and Modigliani 1963).
However, retirees seem to spend much less than theory would predict. Rather than spending down savings during retirement, many studies have found that the value of retirees’ financial assets hold steady or even increase over time (Browning, Huston, and Finke 2015; De Nardi, French, and Jones 2009a; 2009b; Love, Palumbo, and Smith 2009; Poterba, Venti, and Wise 2011a; 2011b; Rix 2000; Smith, Soto, and Penner 2009). This effect has been found to persist even under the required minimum distribution (RMD) rules associated with defined contribution and IRA accounts (Poterba et al. 2011a), which is evidence that retirees take required distributions and reinvest them in other financial assets (Smith and Love 2007). This unwillingness to spend from assets can result in a gap between the amount retirees could safely spend and their actual spending during retirement (Poterba et al. 2011b).
Despite the possibility of low asset returns and longer lives in retirement, are retirees spending an amount that would put them in danger of running out of money? If not, how much more could they be safely spending given their level of accumulated financial assets?
We address these questions using a consumption model and data from the Health and Retirement Study (HRS). In this study, we compared retirees’ actual consumption to that available under multiple asset allocation strategies. A retirement consumption gap (RCG) exists where actual spending is less than available spending.
By considering multiple asset allocation strategies, we analyzed what the RCG would be for retirees with varying preferences for market risk and income certainty. Results suggest that a consumption gap exists across all asset allocation strategies for those with financial assets at the median level and above.
The RCG for wealthier retirees is large. For this group, an overemphasis on shortfall risk may worsen retirement outcomes by encouraging conservative spending from assets saved to fund post-retirement consumption. Understanding this behavior is important, because it provides some insight into retirees’ preferences for spending from financial assets. It also provides an alternative framework for measuring retirement preparedness, while highlighting the importance of estate and charitable planning.
Literature Review
In order for retirees to determine optimal consumption in each retirement period, they must estimate longevity, investment returns, medical costs, Social Security benefits, bequest motives, and pension benefits. Factors that are certain, such as Social Security and pension benefits, can be easily identified and incorporated into decumulation decisions. Uncertain factors may overwhelm a retiree faced with the challenge of drawing just the right amount of income from savings each year.
Davies (1981) and De Nardi, French, and Jones (2009a) argued that uncertain life expectancies are a primary contributor to slow rates of decumulation among retirees. Estimating an amount of money that can be safely withdrawn from an investment portfolio is not easy when lifespan and asset returns are unknown. Browning et al. (2015) found that older retirees who experienced cognitive decline tended to overweight the risks of longevity and medical costs. These more risk-averse retirees may be particularly afraid of liquidating investments to fund spending.
Hurd and Rohwedder (2003) found that even higher-income retirees tend to decrease the amount of money they spend on restaurant meals, substituting food at home for food away from home. It is possible that many overestimate their desire to continue spending the same amount after retirement on spending categories, such as eating out, because retirees have more free time to produce these commodities (Kalenkoski and Oumtrakool 2014). Studies have also found little evidence that bequest motives are strong enough to explain low rates of spending in retirement (De Nardi et al. 2009b; Hurd 1987; Hurd 2003). Unless retirees obtain more happiness from a charity or their heirs spending a dollar than if they spent the dollar themselves, there seems to be little rational explanation for the failure to spend down assets.
Blanchett (2014) explored patterns in spending by age using the HRS and found that average spending appeared to decline during retirement. The decline continues at a more modest rate after health care costs rise in late retirement. Results from Blanchett suggest that a focus on spending early in retirement may actually underestimate the gap between actual and available rates of spending.
Methods
Monte Carlo simulation was used following a product allocation framework (see Milevsky 2009) to analyze the RCG. This methodology provides an improvement over previous work that simply monitored the change in financial asset values over time to evaluate post-retirement consumption patterns.
Data. Data from the HRS were used to analyze the research question. The HRS is a nationally representative longitudinal data set of Americans age 50 and older. It has been administered by the University of Michigan on a biennial basis since 1992. The survey is supported by the National Institute on Aging and the Social Security Administration. In addition to the HRS core survey, the RAND Consumption Activities Mail Survey (CAMS) data was used to estimate consumption. This was done to ensure accurate comparisons between actual and available consumption—the factors used to calculate the RCG in the study.
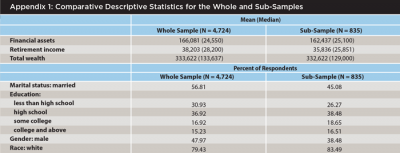
Sample. The sample was limited to retirees between the ages of 65 and 701 in the year 2000 who provided complete responses to the CAMS questions. The total sample included 835 respondents. Respondents were split into quintiles based on the retiree’s level of financial assets. There were 187 respondents in the first quintile of financial assets, 145 in the second, 170 in the third, 166 in the fourth, and 167 in the fifth. By separating the sample into quintiles we were able to analyze the consumption gap more thoroughly by allowing for variation in both the level of financial assets and the asset allocation strategy. Comparative descriptive statistics on the whole sample age 65 to 70 from the HRS and the sub-sample used in this analysis are provided in Appendix 1. The descriptive results indicate that the sample used here was representative of the population.
Determining the retirement consumption gap. The RCG was measured as a percentage. It equals available consumption minus actual consumption divided by available consumption. Positive (negative) numbers derived from this formula indicate actual spending less (more) than what is available under a given asset allocation strategy. Actual consumption, derived from the CAMS, included consumption from transportation, housing-related expenses, clothing, dining, insurance, medical expenses, and entertainment.
Available consumption was determined using Monte Carlo simulations following a product allocation framework. Under this framework, retirees could choose to invest in traditional assets including stocks and bonds, single-premium immediate annuities with a fixed nominal payment, and single-premium immediate annuities with an inflation-adjusted payment.
We considered the following scenarios in the analysis: a 30-year retirement with no reserve for unexpected medical costs and/or bequests, and a highly conservative scenario with a 30-year retirement and 40 percent of the initial financial assets set aside as a reserve for unexpected medical costs and/or bequests. It should be noted that prior retirement spending literature has typically based sustainable spending strategies on a portfolio value that does not assume any carve-out to cover contingencies. We also assumed that all financial assets would be consumed by the end of the retirement period analyzed, which may be most realistic in the set-aside scenario if these assets are used to hedge the possibility of a longer lifespan. The asset allocation strategies used in the analysis are shown in Table 1.
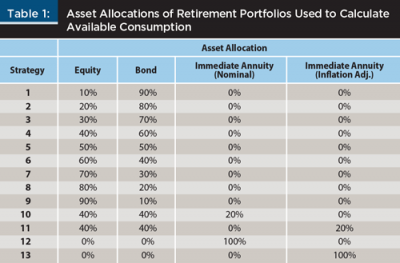
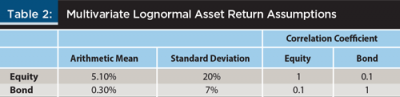
We estimated the consumption gap using a broad range of asset allocations to account for varying levels of available consumption under different portfolio strategies (see Table 1). For each strategy, we ran 3,000 Monte Carlo iterations based on a return series generated by a multivariate lognormal distribution. The optimal consumption amount beginning in the year 2000 was identified based on the probability of successfully funding the retirement period for each iteration. This method is preferable because it accounts for both major market movements and sequence of return risk. We assumed a constant consumption path with an inflation adjustment.
The means, standard deviations, and correlations between and stocks and bonds are presented in Table 2. Similar to Pfau (2013), we assumed a constant inflation rate of 2.10 percent, a payout ratio of 5.84 percent from immediate annuities with fixed nominal payments, and a payout ratio of 3.875 percent from immediate annuities with inflation-adjusted payments.2 Annuity income was used before any assets were liquidated to fund annual consumption. At the beginning of each period, financial assets were rebalanced to their initial asset allocation position.
Results
Consumption relative to income. When analyzing the RCG, we first looked at actual consumption in comparison to total income. Total income was made up of wages, income from employer-sponsored retirement accounts, Social Security, worker’s compensation, unemployment benefits, and capital income from businesses and investments.
Table 3 shows that average total income for respondents in the first and second quintile was less than average total consumption. These groups had very modest financial asset values. Their consumption closely mirrored the annuitized income they received from either Social Security or employer-sponsored pensions.
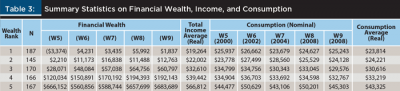
The average total income of respondents in the third, fourth, and fifth quintiles was greater than average total consumption. Without any consideration to the drawdown of financial assets, the consumption of these groups could have been increased simply by spending all available income. Evidence that moderate and higher wealth retirees did not spend all of their income was consistent with the increase in average financial assets over the five-wave analysis period.
It was also determined that nominal consumption for these groups stayed relatively flat over the analysis period. If consumption in each period was presented after inflation (as is assumed in the traditional 4 percent methodology), consumption among retirees in the third, fourth, and fifth quintiles would have decreased over the analysis period.
To gain greater insight into the spending patterns of retirees within the top three financial asset quintiles, the third, fourth, and fifth quintiles were split by income level. Figure 1 shows the income quintiles, lowest to highest, within each financial asset group. After sorting the financial asset quintiles by income level, we calculated the average consumption of respondents at each level of income in Figure 2. In Figure 3 we took the results from Figure 1 and subtracted the results from Figure 2 to compare consumption to income for respondents in the third, fourth, and fifth quintiles of financial assets. Similar to the findings in Table 3, we found that most retirees could increase their consumption simply by spending all of their available income with no spending from financial assets.
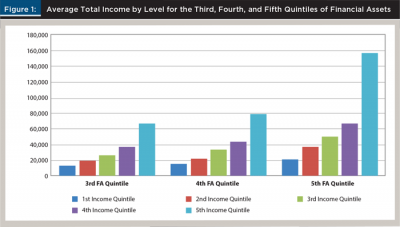
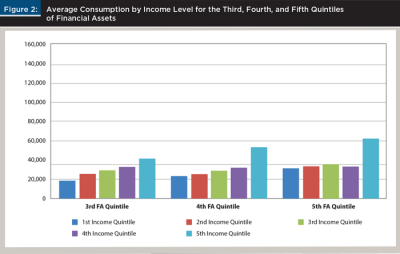
On average, retirees in the lowest income group within each financial asset quintile consumed more than their income in a given year. Most retirees in the middle financial asset category spent more than their income, requiring some drawdown of assets from savings. Most retirees in the fourth and fifth financial asset quintiles, however, spent less than their income. In the fifth quintile, higher income retirees spent much less than their income.
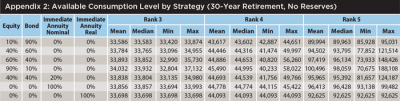
The retirement consumption gap. To determine the RCG in the third, fourth, and fifth quintiles we compared the results from the consumption model, shown in Appendices 2 and 3, to the average consumption values reported in Table 3.
In Figures 4 through 9, the amounts shown below the gray portion of the graph represent the average consumption of respondents in the quintile being analyzed. This number is fixed and allows for comparison of the consumption gap across multiple asset allocation strategies.
The red portion of the graph represents available consumption in excess of actual consumption for each asset allocation strategy. Because we determined the RCG with the consumption value associated with 100 percent success, the red portion of the graph represents the smallest possible gap for each scenario. Portfolios allocated heavily to bonds and SPIAs have little consumption variability and therefore consistently show the largest gap.
The blue portion of the graph represents possible consumption values at varying rates of successfully funding the retirement period. Portfolios more heavily allocated to stocks, while more risky, allow for the possibility of much greater consumption than more conservative portfolios.
Figures 4 and 5 report results for a 30-year retirement with no reserve for unexpected medical costs and/or bequests.
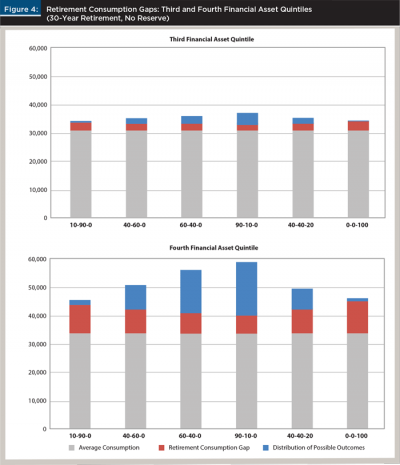
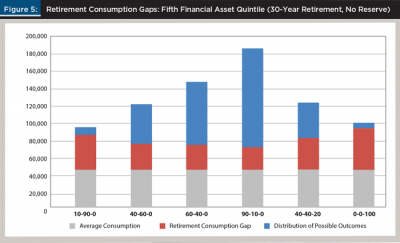
Figure 4 reports the consumption gap for respondents in the third financial asset quintile. Average consumption for this group was $30,616. Available consumption ranged from $32,804 to $33,694. This yields a RCG between 6.7 percent and 9.1 percent across asset allocation strategies, which is consistent with approximate forgone consumption between $65,500 and $92,500 over a 30-year retirement period.
Figure 4 also shows the consumption gap associated with respondents in the fourth quintile of financial assets. Across strategies, the RCG associated with 100 percent success for the fourth quintile ranged from 17.4 percent to 24.7 percent annually. When converted to dollars, this represents a gap of approximately $7,000 to $10,900 per year. This coincides with forgone consumption ranging from $210,000 to $327,000 over a 30-year retirement period.
Figure 5 shows that the annual RCG over a 30-year period for respondents in the fifth quintile of financial assets was significantly larger, ranging from 38.7 percent with a 90/10 stock/bond portfolio to 53.5 percent with a portfolio invested 100 percent in nominal SPIAs. RCGs of this size coincide with annual forgone consumption of approximately $27,400 to $49,800 and total forgone consumption of $820,000 to $1,495,000. These results are consistent with Poterba et al. (2011b), who found that individuals on the upper end of the wealth distribution could increase their annual consumption in retirement by as much as $50,000 annually by annuitizing their retirement wealth.
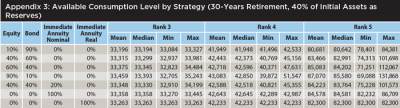
To evaluate scenarios that include a set-aside for uncertain medical expenses, longevity, and bequests (factors thought to reduce the amount retirees feel comfortable spending in retirement), we re-ran the simulations with 40 percent of the beginning financial assets excluded from the analysis and assumed to be held in reserve. The results are presented in Figures 6 and 7.
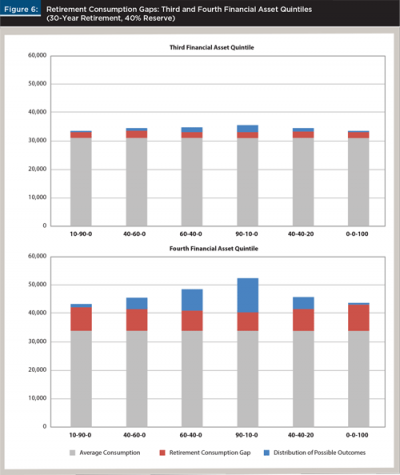
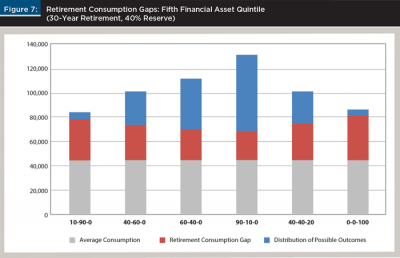
For respondents in the third financial asset quintile, a RCG still existed even after setting aside 40 percent of beginning financial assets. Under this scenario, the RCG ranged from 6.4 percent to 8.0 percent, which is consistent with annual forgone consumption between $2,100 and $2,650. Over a 30-year retirement period, this represents between $62,500 and $79,500.
For wealthier retirees, a RCG of notable size remained even when setting aside a significant portion of the beginning financial assets. This result is not surprising given that most in the fourth and fifth financial asset quintiles under-consumed relative to their income. Retirees could significantly increase their consumption while ensuring their preferences for bequests and reserves.
Results show that retirees in the fourth quintile who wished to ensure a bequest and/or reserve equal to 40 percent of their beginning financial assets could have increased their consumption between $6,650 and $9,100 per year, or between $200,000 and $272,000 over the 30-year retirement period. This is surprisingly high given that the average beginning financial assets of this group was approximately $120,000.
Retirees in the highest financial asset quintile could have set aside 40 percent of their beginning financial assets and increased their annual consumption by between $25,800 and $38,900. With beginning financial assets of approximately $665,000 for this group, this represents a reserve of approximately $265,000 and increased consumption over the retirement period of approximately $773,000 to $1,165,000.
Conclusions and Implications
Using a product allocation framework, this study provides evidence of a retirement consumption gap for those with financial assets in the third, fourth, and fifth financial asset quintiles. In comparison to previous studies that focused on changes in financial asset values to examine post-retirement consumption, the methodology presented here provides a more dynamic evaluation of spending behavior and quantifies the consumption available to (and forgone by) retirees under a variety of asset allocation strategies.
Results show that retirees with median wealth have a consumption gap of approximately 8 percent on average, and that retirees with higher levels of wealth have a consumption gap as high as 53 percent. Even after setting aside 40 percent of beginning financial assets to cover spending risks and bequests, a consumption gap as high as 47 percent still exists for the wealthiest retirees.
The calculations were based on a fixed, 30-year retirement period assumption. Because of the wide variation in expected longevity between males and females and single and married households, future studies should consider replacing static retirement periods with survival probabilities; this is a more robust approach to modeling the impact of uncertain lifespans on post-retirement consumption (Pfau 2012).
Because the average life expectancy of males, females, and married couples is 82, 85, and 89, respectively, and the probability that one member of a married couple will live to age 95 is 18 percent for the average American, it is reasonable to anticipate that replacing static retirement periods with survival probabilities will provide evidence of even greater consumption gaps (Centers for Disease Control and Prevention 2010). This is likely true especially if longevity risk can be efficiently hedged through deferred annuity products.
In other words, if the average retiree dies before the 30-year retirement period ends, the retirement consumption gap, on average, will be even larger than the estimates from this study, as long as they can hedge the risk of longevity through products such as a qualified longevity annuity contract (QLAC).
A number of factors could explain the conservative consumption of retirees. In this analysis, we attempted to capture the effects of uncertain longevity, uncertain medical costs, and bequests when measuring the difference between retirees’ actual and available consumption by assuming that 40 percent of the beginning financial assets are set aside as reserves. To more accurately assess the actual retirement consumption gap, future studies should consider modeling the probability and magnitude of actual medical costs throughout the retirement period. While this would represent an improvement to the current model, it is important to note two caveats. First, consumption in the current model includes medical costs incurred to date; and second, modeling probabilities may not materially decrease the RCG found among respondents with financial assets in the fourth and fifth quintiles.
When considering a 30-year retirement period with a 40 percent reserve, individuals in the fourth and fifth quintiles forgo as much as $272,000 and $1,165,000 of retirement spending, respectively. If the primary goal of the reserve is to cover unexpected medical expenses, then the consumption gap will likely remain for retirees in the fourth and fifth quintiles facing average medical expenses over the retirement period. The only scenario that may significantly reduce or eliminate the RCG for retirees in the fourth quintile is the existence of high-cost, low-probability medical expenses that are unhedged with long-term care insurance.
Although bequests, uncertainty related to longevity, and medical expenses may provide a partial explanation for conservative post-retirement consumption, the results suggest that they do little to justify the RCG captured in the analysis. The findings provide insight into the potential role of behavioral explanations for low post-retirement consumption and call for a more in-depth consideration of the psychological barriers to spending that may exist among retirees.
Fear, failure to plan, and a lack of confidence in pre-determined drawdown strategies may be significant contributors to the conservative consumption observed among retirees. Hung, Meijer, Mihaly, and Yoong (2009) found that few individuals have thought about decumulating their assets in retirement. Of those who have, only about 40 percent have developed a formalized plan for decumulation and, of those, only about 30 percent think their plan will meet their post-retirement consumption needs. It appears that in the absence of annuitized wealth, retirees have little confidence in their ability to decumulate effectively.
Feelings of inadequate preparation may shift retirees’ mindsets from decumulation to preservation. Greenwald, Bryck, and Sondergeld (2006) found that rather than depending on long-term financial planning, retirees are myopic and over-rely on their intuition when adjusting consumption and investment strategies.
This situational approach to post-retirement consumption may increase retirees’ vulnerability to loss aversion. When loss aversion is present, retirees may frame decumulation as a risky proposition and view the conversion of funds from financial assets to fund current spending as a loss. Retirees plagued with this fear of loss may spend less as a defense mechanism to protect against making a perceived financial mistake.
Financial planners need to be aware that dwelling on the risk of running out of money in retirement when advising a retiree who clearly faces little risk of a shortfall may reduce the quality of retirement for the client. Planners compensated based on assets face a clear potential agency conflict by stoking fears of shortfall risk among clients whose spending patterns place them at little risk of outliving assets.
The findings of this research point to the possibility that retirees may have little concern for maximizing their retirement consumption or sustaining their pre-retirement lifestyle. Retirees may view annuitized income from Social Security and employer pensions as their primary source of retirement spending and think of the retirement portfolio only as a reserve to protect against the unexpected. Observing that a client may be spending too conservatively should motivate discussions either to reassure that spending more will not lead to financial ruin, or about estate and charitable planning that is the inevitable consequence of a retirement consumption gap.
Financial planners may also wish to consider how portfolio goals that existed in the accumulation phase may be replaced in retirement with preferences for safety and income efficiency. The low rate of spending from financial assets observed in these results may be a call to financial planners to reevaluate the framing of the relationship between risk and reward when determining optimal retirement income plans for their clients. After retirement, the reward of efficient market returns from the effective management of market risk that was dominant during accumulation may be less important than stable, reliable income from the effective management of risks related to uncertain lifespans and medical costs. Setting aside cash reserves and using annuity products (even when yields are low)—actions contradictory to the traditional practice of portfolio management—may increase retirees’ willingness to spend by increasing the certainty of future income and ensuring resource availability for end-of-life expenses (medical and/or bequests). These actions may increase the confidence of a client and lead to spending patterns more consistent with the goals that motivated accumulation.
Retirement income conversations may need to move away from sustainable withdrawal rates toward strategies that maximize spending for a given level of financial assets, while addressing client concerns about uncertainties. A shift of this nature would require less focus on asset management and more attention on income management to ensure that clients receive the highest possible satisfaction from their accumulated retirement wealth.
Endnotes
- This limitation was put in place to limit the evaluation to the cohort of respondents who were likely recently retired when RAND began administering the CAMS. This approach allowed for an evaluation of consumption toward the beginning of the retirement period while observing changes over time. By looking at this cohort exclusively, it was possible to eliminate empirical issues that may arise from cohort and life cycle effects.
- There was no variation in real consumption for portfolios invested in 100 percent inflation-adjusted SPIAs during the retirement period. This created a graphical limitation in the software package used to estimate the consumption gap. As a result, strategies using 100 percent inflation-adjusted SPIAs are not reported. Appendices 2 and 3 show the available consumption and measure the RCG with strategies including inflation-adjusted SPIAs.
References
Ando, Albert, and Franco Modigliani. 1963. “The ‘Life Cycle’ Hypothesis of Saving: Aggregate Implications and Tests.” The American Economic Review 53 (1): 55–84.
Bengen, William P. 1994. “Determining Withdrawal Rates Using Historical Data.” Journal of Financial Planning 7 (4): 171–180.
Blanchett, David. 2014. “Exploring the Retirement Consumption Puzzle.” Journal of Financial Planning 27 (5): 34–42.
Browning, Chris, Sandra J. Huston, and Michael S. Finke. 2015. “Cognitive Ability and Post-Retirement Asset Decumulation.” Journal of Family and Economic Issues July: 1–12.
Centers for Disease Control and Prevention. 2010. “Health, United States, 2010: With a Special Feature on Death and Dying.” www.cdc.gov/nchs/data/hus/hus10.pdf#022.
Cooley, Philip L., Carl M. Hubbard, and Daniel T. Walz. 1998. “Retirement Savings: Choosing a Withdrawal Rate that Is Sustainable.” AAII Journal 20 (2): 16–21.
Davies, James B. 1981. “Uncertain Lifetime, Consumption, and Dissaving in Retirement.” The Journal of Political Economy 89 (3): 561–577.
De Nardi, Mariacristina, Eric French, and John Bailey Jones. 2009a. “Life Expectancy and Old Age Savings.” National Bureau of Economic Research Working Paper w14653.
De Nardi, Mariacristina, Eric French, and John Bailey Jones. 2009b. “Why Do the Elderly Save? The Role of Medical Expenses.” National Bureau of Economic Research Working Paper w15149.
Greenwald, Mathew, Sally A. Bryck, and Eric T. Sondergeld. 2006. “Spending and Investing in Retirement: Is There a Strategy?” Society of Actuaries and LIMRA International Research Projects Working Paper.
Guyton, Jonathan T. 2004. “Decision Rules and Portfolio Management for Retirees: Is the ‘Safe’ Initial Withdrawal Rate Too Safe?” Journal of Financial Planning 17 (10): 54–62.
Hung, Angela, Erik Meijer, Kata Mihaly, and Joanne Yoong. 2009. “Building Up, Spending Down: Financial Literacy, Retirement Savings Management, and Decumulation.” RAND Working Paper 712.
Hurd, Michael D. 1987. “Savings of the Elderly and Desired Bequests.” The American Economic Review 77 (3): 298–312.
Hurd, Michael D. 2003. “Are Bequests Accidental or Desired?” RAND Working Paper 03-13.
Hurd, Michael, and Susann Rohwedder. 2003. “The Retirement-Consumption Puzzle: Anticipated and Actual Declines in Spending at Retirement.” National Bureau of Economic Research Working Paper w9586.
Kalenkoski, Charlene M., and Eakamon Oumtrakool. 2014. “How Retirees Spend Their Time: Helping Clients Set Realistic Income Goals.” Journal of Financial Planning 27 (10): 48–53.
Love, David A., Michael G. Palumbo, and Paul A. Smith. 2009. “The Trajectory of Wealth in Retirement.” Journal of Public Economics 93 (1): 191–208.
Milevsky, Moshe A. 2009. Are You a Stock or a Bond? Create Your Own Pension Plan for a Secure Financial Future. Upper Saddle River, NJ: Pearson Education.
Pfau, Wade D. 2012. “Choosing a Retirement Income Strategy: A New Evaluation Framework.” Retirement Management Journal 2 (2): 33–44.
Pfau, Wade D. 2013. “A Broader Framework for Determining an Efficient Frontier for Retirement Income.” Journal of Financial Planning 26 (2): 44–51.
Poterba, James M., Steven F. Venti, and David A. Wise. 2011a. “The Drawdown of Personal Retirement Assets.” National Bureau of Economic Research Working Paper w16675.
Poterba, James M., Steven F. Venti, and David A. Wise. 2011b. “The Composition and Draw-Down of Wealth in Retirement.” National Bureau of Economic Research Working Paper w17536.
Rix, Sara E. 2000. “Patterns of Dissaving in Retirement.” Public Policy Institute Working Paper. Washington: AARP.
Smith, Paul A., and David A. Love. 2007. “Measuring Dissaving Out of Retirement Wealth.” SSRN working paper 968431.
Smith, Karen E., Mauricio Soto, and Rudolph G. Penner. 2009. “How Seniors Change Their Asset Holdings During Retirement.” The Center for Retirement Research at Boston College Retirement Policy Program Discussion Paper 09-06.
Citation
Browning, Chris, Tao Guo, Yuanshan Cheng, and Michael S. Finke. 2016. “Spending in Retirement: Determining the Consumption Gap.” Journal of Financial Planning 29 (2): 42–53.