Journal of Financial Planning: September 2011
Lewis W. Coopersmith, Ph.D., is an associate professor of management sciences at Rider University in Lawrenceville, New Jersey, and provides consulting to industry and government on forecasting and market dynamics. He can be reached at coopersmith@rider.edu.
Alan R. Sumutka, CPA, is an associate professor of accounting at Rider University in Lawrenceville, New Jersey, and the owner of Alan R. Sumutka, CPA.
Executive Summary
- A common rule (CR) for withdrawing retirement savings is to withdraw taxable savings before tax-deferred savings, but this strategy can inflate required minimum distributions (RMDs) and reduce tax efficiency and wealth. However, tax-efficient (TE) withdrawal schemes can determine withdrawals that maximize the final total account balance over a retirement horizon.
- We consider identical scenarios (for example, initial wealth, living expenses excluding federal taxes, Social Security, tax deductions), but use different withdrawal methods (TE using a linear programming spreadsheet model versus CR) to determine withdrawals and federal taxes while satisfying RMDs over a 25-year planning horizon (to age 90). We compare the final total account balances for various combinations of taxable rates of return (ROR), tax-deferred ROR, initial taxable savings, and itemized deductions.
- Results show that TE models can significantly outperform CR when taxable ROR is greater than tax-deferred ROR, initial taxable wealth is greater than 10 percent of total retirement wealth, and itemized deductions are greater than the standard deduction. For a realistic combination of these conditions, total remaining account balances for TE are shown to be more than 16 percent higher than CR.
With the U.S. population aging and baby boomers reaching retirement age, attention has focused on how nest eggs can best provide income during retirement. Recent articles and papers such as Davis (2009) and Seibert and Meredith (2010) discuss policies and procedures used in retirement planning. They include distribution (or decumulation) plans that consist of sequencing withdrawals from retirement savings needed to satisfy a desired lifestyle.
Distribution planning is simple if one has only tax-deferred accounts and/or a pension. However, nest eggs often consist of various accounts (taxable savings, tax-deferred savings, Roth IRAs) that often produce different rates of return (ROR) and tax liabilities. For example, stocks generally produce a higher ROR than bonds and are often a high percent of tax-efficient taxable savings portfolios, which provide low tax rates for qualified dividends and long-term capital gains. In contrast, bonds often provide a lower ROR than stocks; if held in taxable savings, the interest is taxed annually at ordinary income tax rates. Thus, bonds are often a high percent of tax-deferred savings portfolios in which the interest is sheltered from taxation until withdrawn and then taxed entirely as ordinary income.
When the retirement nest egg includes both taxable and tax-deferred savings, a common rule (CR) for sequencing withdrawals is to spend taxable savings before withdrawing tax-deferred savings, allowing tax-deferred earnings to grow continuously in a tax-sheltered environment. It can be shown that CR usually provides the highest growth in wealth over a one-year period. However, even over a one-year horizon, it is better to retain taxable savings when the taxable ROR is higher than the tax-deferred ROR plus the marginal tax on the tax-deferred withdrawal (see the online appendix, A Marginal Analysis, at www.FPAnet.org/Journal/Sept11Appendix). Reichenstein notes that the latter scenario should rarely occur (see Buttell (2010a)). The most likely exception would arise when the marginal tax rate is zero (tax deductions exceed income) and the ROR for taxable savings (for example, 8 percent) is greater than the ROR on tax-deferred savings (for example, 4 percent). However, when RORs for taxable and tax-deferred savings are close, complex aspects of the tax laws such as tax brackets and required minimum distributions (RMDs) after age 70½ may make it more tax efficient and financially advantageous to withdraw from tax-deferred accounts earlier than required to avoid less tax efficiency later in retirement.
We consider a withdrawal plan tax efficient (TE) if it includes all of the following:
- Consideration of more than one annual withdrawal plan over a retirement horizon, where each plan differs by the sequence of withdrawals from different accounts and each account has a different tax treatment
- A realistic calculation of taxes for each plan
- Selection of the plan that is best with respect to some performance measure (for example, final total account balance)
CR plans make withdrawals from taxable savings until they are exhausted, unless RMDs mandate early withdrawals from tax-deferred savings. As tax-deferred savings increase early in retirement, future RMDs may produce excessive withdrawals taxed at higher than expected tax rates. In contrast, TE plans withdraw from either taxable or tax-deferred savings to generate the maximum total remaining account balance at the end of 25 years (or whatever the retirement horizon). TE plans may withdraw from tax-deferred savings earlier than needed and transfer additional amounts to taxable savings to avoid future large tax payments. TE plans tend to create annual taxable income levels taxed at similar marginal tax brackets, reduce future excessive RMDs, bolster the more tax-efficient taxable savings, and enhance overall wealth over long periods.
The importance of tax efficiency is emphasized by Ed Slott, who states, “If you really want to attract the retirement market, you have to address the tax planning issues involved. It’s the number one, biggest factor that will separate people from their money” (see Buttell (2010a)). Guyton (2010) also emphasizes the need for “tax efficiency on both a short- and long-term basis.” Coopersmith, Sumutka, and Arvesen (2009) use mathematical optimization (as discussed below) to achieve tax efficiency for retirement savings that include taxable and tax-deferred savings. Feedback from this earlier paper suggested comparing TE and CR plans for a wide range of variables. In this paper we address this objective and more thoroughly evaluate when TE models provide significant practical benefits over CR plans.
Literature Review
Prior literature on tax efficiency compares withdrawal strategies under a variety of conditions. Ragsdale, Seila, and Little (1994) refer to a withdrawal plan as “heuristic” when it is based on a subjective rule. CR is an example of a heuristic plan considered in many papers. A TE plan is “mathematically optimal” when it provides the best outcome for all possible plans. Mathematical optimization, although desirable, may not always be achievable quickly. When a spreadsheet is used to determine a TE plan, a mathematically optimal model runs fast when a cell in a spreadsheet (for example, final total account balance) is selected as the performance measure and a time-efficient mathematical optimization method, for example linear programming (LP), is used to optimize that cell. However, the practical use of mathematical optimization diminishes rapidly with increasing run time when various “non-linear” aspects of the tax code are introduced (for example, the exact taxable amount of Social Security) or when the performance measure is not a single cell (for example, longevity, which is the length of time before funds are exhausted).
Ragsdale, Seila, and Little (1994) examine mathematically optimal TE withdrawals using an LP model. Subsequent papers that use heuristic TE methods have expressed concern that the Ragsdale model is not applicable to the current tax code. This concern is not valid because optimization models can easily be adapted to changes in federal tax and estate laws. This is demonstrated by the LP model of Coopersmith, Sumutka, and Arvesen (2009), which includes taxable savings and Social Security and allows for tax deductions (standard deduction and exemptions) and tax brackets. The LP model used in our current research runs in less than a minute, making it quite time efficient for generating the many alternative results discussed below.
Many recent papers use heuristic methods of retirement withdrawal planning, but not all assess tax impact. Spitzer and Singh (2006) consider initial wealth divided between taxable and tax-deferred savings and compare longevity for various portfolio scenarios assuming a flat rate of taxation. Horan (2006) includes multiple tax brackets, deductions, and exemptions, but not RMDs, to evaluate six rules for sequencing withdrawals from Roth and traditional IRA accounts; total remaining account balance is used as a comparative measure. Van Harlow and Feinschreiber (2006) distribute wealth among various account types and consider federal taxes to develop five guidelines for maintaining a “personal withdrawal ‘hierarchy’ that is tax efficient.” Bernachhi (2008) includes RMDs, tax brackets, and CR plans to determine the mix of taxable and tax-deferred savings at the start of retirement that results in the highest final total remaining account balance. Spitzer (2008) studies the impact of RMDs on average balance remaining for four withdrawal cases. He computes approximate federal taxes and considers a broad range of portfolio possibilities. We use Spitzer’s terminology and expand on his research design as described below.
Research Design
Two withdrawal plans are compared with respect to the total account balance remaining at the end of 25 years:
- CR: At the start of each year, taxable savings are withdrawn to satisfy expenses and taxes; if not sufficient, tax-deferred savings are also withdrawn. When RMDs apply, excess tax-deferred withdrawals are transferred to taxable savings at year end.
- TE: An LP model similar to that employed in Coopersmith, Sumutka, and Arvesen (2009) is used to determine tax-efficient annual withdrawals from taxable and tax-deferred savings. Withdrawals used to satisfy specified living expenses and taxes are made at the start of each year. If additional withdrawals from tax-deferred savings are needed for RMDs or to achieve tax efficiency over the longer planning horizon, the excess is transferred to taxable savings at year-end. The CR and TE withdrawal plans compared in this research are identical with respect to the following:
- Withdrawals are for a married couple, both age 65.
- Total savings (taxable plus tax-deferred) are initially $1 million.
- 25 years of withdrawals are calculated, ending with the couple at age 90; we consider this a suitable horizon for comparing the two withdrawal planning methods.
- Annual living expenses (excluding federal taxes) are fixed initially at Social Security ($20,000) plus a percent of total savings. For example, $50,000 initial total annual living expenses would be drawn: $20,000 from Social Security plus $30,000 (or 3 percent) from the $1 million savings. We use initial withdrawal rates of 3 percent, 4 percent, and 5 percent of total savings. Past literature listed in Salter and Evensky (2008) has found these rates to have relatively low sustainability risk, defined as the probability of exhausting retirement funds during the planning horizon. Because we compare CR and TE plans with the same annual initial withdrawal rates, we leave the evaluation of differences between CR and TE relative to sustainability risk for future research.
- Federal taxes, if any, require additional withdrawals from savings.
- 2010 tax laws are used in determining all tax issues.
- Interest from taxable savings and withdrawals from tax-deferred savings are taxable as ordinary income; the couple earns no dividends or capital gains.
- 85 percent of Social Security is taxed.
- RMDs are determined as prescribed by federal law and must be satisfied.
- Tax deductions of a standard deduction for a married couple who files jointly ($12,500) and two exemptions ($3,650 for each) are subtracted from income to arrive at taxable income.
- Annual cost of living adjustments of 2 percent are applied to living expenses (before federal taxes), Social Security, deductions, and tax brackets.
- Federal income taxes are based on taxable income and are computed as part of the process of calculating the withdrawal amounts for each plan:
- For CR, the computation of federal taxes for a given taxable income is formulated in a spreadsheet.
- For TE, the computation of federal taxes is built into the LP model as in Coopersmith, Sumutka, and Arvesen (2009). - The comparative measure of wealth is the total account balance remaining (in taxable plus tax-deferred savings) at the end of 25 years.
Scenarios are compared for combinations of:
- Taxable ROR: 5 percent, 6 percent, 7 percent
- Tax-deferred ROR: 5 percent, 6 percent, 7 percent
- Percent of initial total wealth in taxable savings: 0 percent, 5 percent, 10 percent, 15 percent, 20 percent, 25 percent
- Amount of deductions, excluding exemptions: standard deduction, 1.25 x standard, 1.50 x standard, 1.75 x standard, 2.00 x standard
Results
To illustrate the difference between TE and CR plans, we consider the case in which:
- Initial total savings of $1 million is $200,000 taxable plus $800,000 tax-deferred
- Initial annual withdrawal is $40,000 (4 percent of initial total savings)
- Taxable ROR is 7 percent; tax-deferred ROR is 5 percent
The use of LP ensures that the TE plan never has a lower comparative remaining total account balance after 25 years. Tables 1 and 2 illustrate the differing withdrawal streams for CR and TE plans, respectively; federal taxes and RMDs are shown for each plan. Table 3 compares annual account balances over 25 years of withdrawals for CR and TE. As will be demonstrated, TE generates $100,000 more in total remaining account balance after 25 years than CR (a 14 percent improvement) and provides additional financial and estate planning advantages.
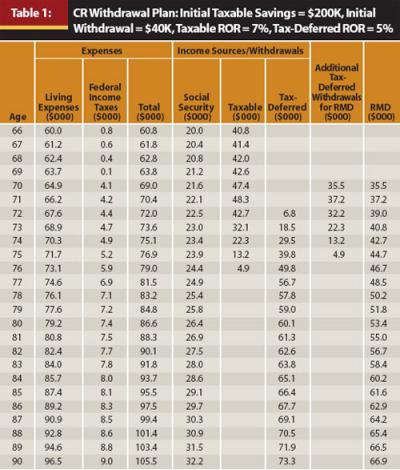
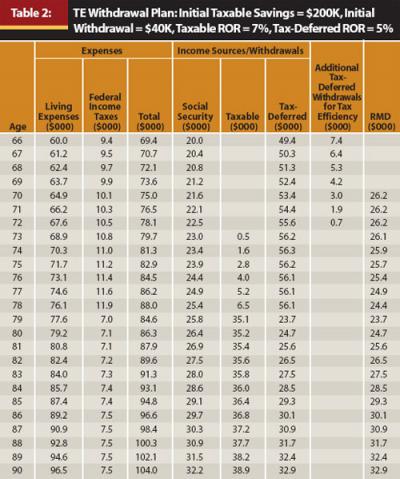
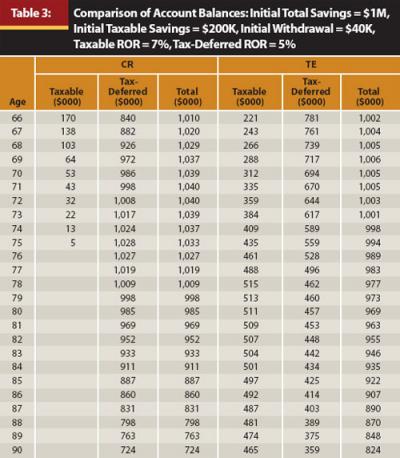
Table 1 illustrates that, to satisfy total required expenses, CR withdraws only from taxable savings through age 71. Additional amounts must be withdrawn from tax-deferred savings from ages 70 to 75 and transferred to taxable savings at year-end to satisfy RMDs. This action causes a spike in taxes from $100 at age 69 to $4,100 at age 70. Taxable savings are depleted at age 76, after which all withdrawals must be made from less tax-efficient, tax-deferred savings.
In contrast, Table 2 illustrates the withdrawal pattern of the TE plan:
- From ages 66 through 72, TE withdraws only from tax-deferred savings ($49,400 to $55,600, respectively) to satisfy total required expenses
- From ages 66 through 72, TE withdraws additional amounts at year-end from tax-deferred savings ($7,400 to $700, respectively) then transferred to taxable savings to provide tax efficiency over the longer horizon
- From ages 70 through 78, TE
tax-deferred withdrawals ($53,400 to $56,100, respectively) exceed RMDs ($26,200 to $24,400, respectively) - From ages 79 through 90, TE tax-deferred withdrawals ($23,700 to $32,900, respectively) equal RMDs; withdrawals from the more tax-efficient taxable savings ($35,100 to $38,900, respectively) constitute the bulk of withdrawals
Table 3 displays 25 years of account balances for CR and TE. As expected, CR depletes all taxable savings by age 75; at age 90, $724,000 of tax-inefficient, tax-deferred savings remains. In contrast, TE produces increasing taxable savings balances through age 78; subsequent taxable savings balances stay above 50 percent of the total account balance. At age 90, the TE balance is $824,000 ($359,000 tax-deferred plus $465,000 taxable), which is a $100,000 or 13.9 percent improvement over CR. The final high balance in taxable savings provides further tax benefits after age 90, for example, higher after-tax proceeds if annuities are chosen, or a reduced tax burden for heirs.
An interesting observation is that tax efficiency does not necessarily mean tax minimization. The cumulative taxes over 25 years (computed using Tables 1 and 2) are $146,000 for CR and $225,000 for TE (about $3,000 more annually). Planners need to carefully explain this effect to clients, pointing out that increases in taxes are offset by greater wealth accumulation of TE. For CR (in Table 1), taxes are low before age 70 when income subject to tax includes interest on taxable savings and 85 percent of Social Security; these are largely offset by deductions. However, at age 70 RMDs are $35,500 and increase annually to $66,900 at age 90, causing annual taxes to increase from $4,100 to $9,000, respectively. In contrast, for TE (in Table 2) from ages 66 to 70, taxes are significantly higher than CR ($9,400 to $10,100 annually) because TE draws only from tax-deferred savings. However, these high withdrawals in early years result in RMDs consistently lower than CR and fall below half that of CR at age 78. Specifically, at age 90 the RMD for TE is $32,900, which is significantly below the RMD of $66,900 for CR. From ages 70 through 78, taxes increase from $10,100 to $11,900; but from age 79 to 90, when RMDs are at their lowest (and equal total tax-deferred withdrawals), taxes average only around $7,000 per year.
In this example, CR generates lower cumulative taxes during retirement by first depleting the more tax-efficient taxable account. However, because the taxable account is higher yielding, lower wealth results at age 90 and leaves higher taxes for heirs by bequeathing the less tax-efficient tax-deferred savings. TE trades off higher cumulative taxes earlier in retirement by depleting lower-yielding tax-deferred accounts to provide greater wealth at age 90 and lower taxes for heirs. Simply, TE builds up the higher-yielding, more tax-efficient taxable savings, which creates both greater wealth and cumulative taxes.
How do differences in taxable ROR and tax-deferred ROR affect ending wealth for TE versus CR withdrawal sequences? Figure 1 compares results for different tax-deferred RORs: 5 percent in Graph A, 6 percent in Graph B, and 7 percent in Graph C. Each graph shows the percent improvement of total remaining account balance of TE over CR for taxable RORs of 5 percent, 6 percent, or 7 percent for different initial annual withdrawals of $30,000 (3 percent), $40,000 (4 percent), or $50,000 (5 percent). These RORs, which represent a mix of stocks and bonds, are in line with reported historical RORs. Spitzer and Singh (2006) assume a 7.2 percent return for stocks and 3.5 percent return for bonds for the 40-year period ending in 2003. More recently, Weigand and Irons (2008) use a stock ROR of 10.34 percent and a bond ROR of 4.13 percent for the 25-year period ending in 2006.
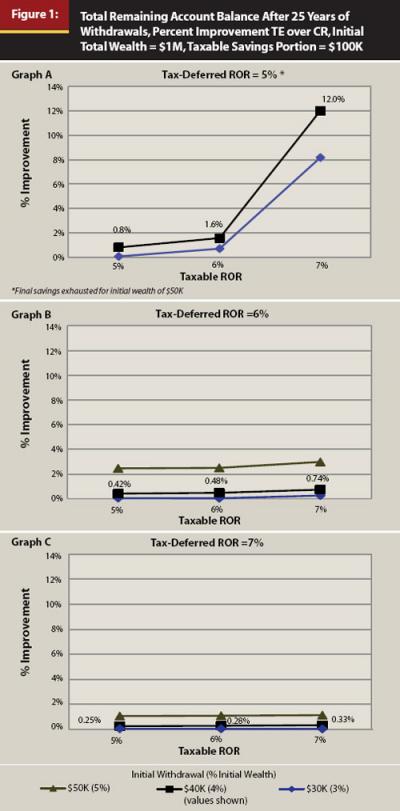
Graph A shows that for initial withdrawals of 3 percent or 4 percent, when tax-deferred ROR is 5 percent and taxable ROR is 5 percent or 6 percent, the percent improvement in TE over CR is minimal. However, when taxable ROR increases to 7 percent, the improvement is much higher, jumping to more than 8 percent for a $30,000 (3 percent) initial withdrawal. For an initial withdrawal of $40,000 (4 percent), the TE benefit is magnified to 12 percent because TE can withdraw more from the lower-yielding tax-deferred savings earlier to satisfy expenses.
Graphs B and C illustrate that as the tax-deferred ROR increases to 6 percent and 7 percent, respectively, the yield advantage of taxable savings is reduced (note values shown for $40,000 (4 percent)) resulting in greatly reduced benefits of TE over CR for any amount of the initial withdrawal. However, each graph in Figure 1 shows that the benefits of TE over CR grow with increasing initial withdrawal rates.
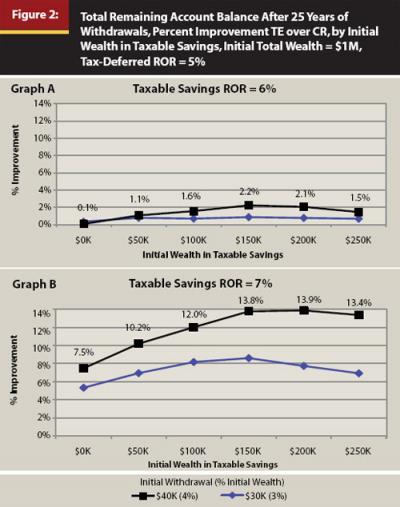
How do changes in levels of initial taxable savings affect the improvement in ending wealth of TE over CR? Figure 2 illustrates the changes when the initial wealth in taxable savings increases from $0 to $250,000, in $50,000 increments. Here tax-deferred ROR is 5 percent, and the taxable ROR is 6 percent (Graph A) and 7 percent (Graph B). First, we see that as the amount of initial wealth in taxable savings increases, the TE advantage grows. For all initial withdrawal rates, the improvement in TE over CR peaks at around $150,000/$200,000 of taxable savings. As taxable savings rise beyond $200,000, the percentage improvement in TE over CR declines. Obviously, if the entire amount of wealth is in taxable savings, TE and CR would produce identical results. Second, when the taxable ROR increases (6 percent to 7 percent), the benefit of retaining the more tax-efficient taxable savings and withdrawing tax-deferred savings increases. The greatest improvement is around 13.9 percent when taxable ROR is 7 percent and the initial withdrawal is $40,000 (4 percent).
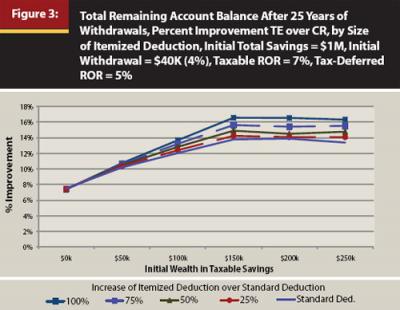
Is there a greater level of improvement in TE over CR if a taxpayer itemizes deductions to lower taxable income and possibly reduce the marginal tax rate? Figure 3 illustrates the improvement when the basic standard deduction is $12,500, but itemized deductions are $15,625, $18,750, $21,875, and $25,000 (or 125 percent, 150 percent, 175 percent, and 200 percent of the standard deduction, respectively), and the initial wealth in taxable savings varies by $50,000 increments from $0 to $250,000. When taxable savings are between $150,000 and $250,000, TE provides a total remaining account balance more than 16 percent higher than CR when itemized deductions are double the standard deduction.
Conclusion
Retirement savings frequently include both taxable and tax-deferred components. At retirement, a common rule (CR) for withdrawal planning is to spend taxable savings first. Although this is a good rule, it is not always best. Tax-efficient models (TE) can be used to plan withdrawals so that retirement lifestyle goals and financial objectives are met while providing high growth in total savings. Results for TE models can be determined within a minute and can be presented in a spreadsheet format identical to that of CR or other withdrawal planning methods. Key aspects of complex tax laws and government restrictions on use of retirement savings (for example, RMDs) are built into TE models that can easily be revised as laws change. The fast and automatic nature of TE planning allows financial planners to focus on “what if” analyses that might vary by investment strategy and alternative streams of annual living expenses.
We compare TE to CR results for different financial scenarios in which data for the two methods are identical in every way. Only the amounts of annual withdrawals from taxable and tax-deferred accounts vary and consequently change the amount of federal taxes due. Our measure of comparison is the total remaining account balance (taxable plus tax-deferred) after 25 years. Because the TE model uses LP to determine withdrawal amounts, the total remaining account balance for TE can never be less than that for CR. However, a TE plan can be identical or close to CR under many conditions.
Our results imply that TE models can significantly outperform CR for combinations of the following conditions:
- Taxable ROR is greater than tax-deferred ROR
- Initial taxable savings are greater than 10 percent of total retirement savings
- Itemized deductions are greater than the standard deduction
The first two conditions favor sustaining initially high taxable savings to provide higher growth. Increasing tax deductions may lower the marginal tax rate to enhance the financial advantage of transferring tax-deferred savings to taxable savings early in retirement.
TE models appear to perform similarly to CR models for:
- Relatively low initial taxable savings
- Taxable ROR that is less than, or very close to, tax-deferred ROR
- Standard or low itemized deductions
Under these conditions there is little or no growth advantage in early withdrawal of tax-deferred savings or transfer of funds from tax-deferred to taxable accounts. The initial low level of taxable savings is depleted early for both planning methods.
Employers and financial institutions have traditionally promoted tax-deferred investments with the result that many retirees are mostly or entirely invested in tax-deferred retirement savings. However, recent studies such as Bernachhi (2008) have highlighted the benefits of commencing retirement with both taxable and tax-deferred savings. This provides incentive to financial planners to encourage clients to accumulate some taxable savings prior to retirement. Thus, we may expect more retirees whose retirement savings and tax requirements satisfy many of the conditions favoring the use of TE. Our results show a combination of conditions favoring TE models can provide better than a 16 percent improvement in savings growth over CR. Thus, TE models have the potential to provide highly effective support in planning retirement withdrawals.
Future research may show how the relative benefits of TE models might change as more details of the tax laws are considered explicitly, such as reduced taxes on capital gains and Roth IRAs. Another area for further study is how best to allocate assets between stocks and bonds in light of the tendency of TE withdrawal planning to prolong the availability of taxable savings.
References
Bernachhi, Ben T. 2008. “Determining the Proper Starting Balance for Taxable and Tax-Deferred Savings at Retirement.” Journal of Financial Planning 21, 7: 56–62.
Buttell, Amy E. 2010a. “Ed Slott on Roth IRAs, Automatic IRAs, and Retirement Planning.” Journal of Financial Planning 23, 10: 20–24.
Buttell, Amy E. 2010b. “William Reichenstein on Retirement Investing, Withdrawals, and Tax Efficiency.” Journal of Financial Planning 23, 11: 18–22.
Coopersmith L., A. R. Sumutka, and J. Arvesen. 2009. “Optimal Tax-Efficient Planning of Withdrawals from Retirement Accounts.” Academy of Financial Services Proceedings (October).
www.academyfinancial.org/09Conference/09Proceedings/%283B%29%20Coopersmith,%20Sumutka,%20Arvesen.pdf.
Davis, Brad. 2009. “Six Steps to Building an Effective Retirement Income Strategy.” Journal of Financial Planning 22, 12: 18–19.
Guyton, J. T. 2010. “The Withdrawal Policy Statement.” Journal of Financial Planning 23, 6: 41–44.
Horan, S. M. 2006. “Optimal Withdrawal Strategies for Retirees with Multiple Savings Accounts.” Journal of Financial Planning 19, 11: 62–75.
Ragsdale, Cliff T., Andrew F. Seila, and Philip L. Little. 1994. “An Optimization Model for Scheduling Withdrawals from Tax-Deferred Retirement Accounts.” Financial Services Review 3, 2: 93–109.
Salter, John R., and Harold Evensky. 2008. “Calculating a Sustainable Withdrawal Rate: A Comprehensive Literature Review.” Journal of Personal Finance 6, 4: 118–137.
Seibert, Kevin S., and Betty Meredith. 2010. “Managing Retirement Income for the Mid-market.” Journal of Financial Planning 23, 8: 32–37.
Spitzer, John J. 2008. “Do Required Minimum Distributions Endanger ‘Safe’ Portfolio Withdrawal Rates?” Journal of Financial Planning 21, 8: 40–51.
Spitzer, John J., and Sandeep Singh. 2006. “Extending Retirement Payouts by Optimizing the Sequence of Withdrawals.” Journal of Financial Planning 19, 4: 52–61.
Van Harlow, W., and S. Feinschreiber. 2006. Beyond Conventional Wisdom: New Strategies for Lifetime Income. Fidelity Research Institute.
Weigand, Robert A., and Robert Irons. 2008. “When Does a Bonds-First Withdrawal Sequence Extend Portfolio Longevity?” Journal of Financial Planning 21, 11: 66–77.