Journal of Financial Planning: November 2016
Wade D. Pfau, Ph.D., CFA, is a professor of retirement income at The American College, principal at McLean Asset Management, and host of the Retirement Researcher website, RetirementResearcher.com.
Longevity risk in retirement is the risk of running out of assets before running out of life. We know about the distribution of longevity for the overall population, but an individual cannot know in advance precisely where he or she will fall in that distribution. The length of one’s retirement could be much shorter or longer than their statistical life expectancy. A longer life is wonderful, but it is also costlier. The variation in potential length of life is quite wide, making longevity risk the fundamental risk for retirement.
Your clients may live longer than they expect. Popular discussions of longevity risk tend to underestimate it for three general reasons as it relates to the circumstances of your clients:
1. Life expectancy may not be measured from the relevant age. Life expectancy at birth is the number that may be most familiar to people, although it is of little relevance for someone reaching retirement. If you have reached age 65, then an obvious point to note is that you did not die prior to age 65. Life expectancy conditional upon reaching age 65 is higher than life expectancy at birth; it continues to increase with age, just not on a one-to-one basis. Because life expectancy at birth gets quoted frequently, individuals may underestimate how long they may live in retirement, and we must reflect carefully about from which age life expectancy is being measured.
2. Life expectancy may be calculated from current year mortality rates instead of projected future mortality rates. Probably the most commonly used source of mortality data is the Social Security Administration’s (SSA) period life tables. A period life table makes calculations about remaining longevity using the mortality data at various ages from one year in time. For instance, calculations for the life expectancy of the 65 year old would in a particular year be made based on how many 70 year olds died that year, 80 year olds, and so on. This method has the advantage of using actual data without requiring any sort of projections. But it will underestimate life expectancies on account of the persistent trends for increasing life expectancies over time.
The alternative is to use a cohort life table, which tracks mortality for the same individual over time. When a 65 year old in 2016 turns 85 in 2036, their mortality rate at 85 will most likely be lower than the mortality rate for an 85 year old in 2016. A cohort life table uses projections for future mortality improvements when calculating life expectancies. Cohort life tables will project longer lives and are surely a better choice for considering longevity when building a retirement income plan. A practical implication of this is that clients who estimate their own longevity based on their parents will be underestimating the persistent trends in improving longevity over time.
3. The underlying population for which mortality and survivorship is being calculated may not be relevant for your clients. It may seem natural to base life expectancy calculations on the aggregate U.S. population, as is done with the Social Security Administration’s period life tables. But clear socioeconomic differences have been identified in mortality rates. Higher income levels and more education both correlate with longer lifespans. This may not be a matter of causation (that more income and education cause people to live longer). Perhaps, instead, there is an underlying personality trait that leads some people to have a more long-term focus, and that in turn may lead them to seek more education and practice better health habits. The average individual working with a financial planner will undoubtedly live longer than the average person in the United States. There are important links between income, education, long-term planning, and health.
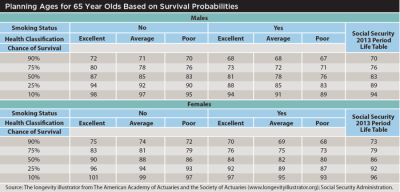
The table provides information about longevity to help clients obtain a better idea about what planning age to use in their retirement plan. I focus on the probability of survival from age 65 for males and females. The joint longevity for at least one person in a two-person household is even larger than the numbers reported in the table.
The Longevity Illustrator from the American Academy of Actuaries and the Society of Actuaries is a free resource providing longevity estimates based on gender, age, smoking status, and an overall evaluation of health (longevityillustrator.org). It accounts for the three concerns expressed earlier: longevity is expressed conditional on already living to a particular age, longevity is based on projections for future mortality improvements, and longevity is based on an appropriate self-selected population with more similar mortality characteristics.
A Wake-Up Call?
Numbers in the table may be surprising and serve as an important wake-up call. For a client who is self-managing their longevity risk, the idea is to choose a sufficiently long time horizon that one is unlikely to outlive, and to then ensure that one’s plan can work for this long. Those with greater longevity risk aversion (the fear of outliving their resources) will seek a higher planning age with a lower probability to outlive. Individuals pick planning ages that are sufficiently conservative to reflect their personalized concerns about outliving their wealth.
Choosing planning ages based on only a 10 percent chance for outliving may be a reasonable baseline assumption.
With a 10 percent chance for survival, the Social Security Administration’s period life table suggests a planning age of 94 for males and 96 for females. But with the more refined actuarial data, these planning ages are too conservative for non-smokers, even those in poor health. For male non-smokers, those in excellent health should consider age 98, and for female non-smokers in excellent health the appropriate planning age is actually 101.
The table also helps to highlight the wide distribution of longevity. For instance, 65-year-old non-smoking males in excellent health face a 10 percent chance of dying by 72 and a 10 percent chance of living beyond 98. That is a 26-year difference.
In 1994, William Bengen chose 30 years as a conservative planning horizon for a 65-year-old couple when he wrote about sustainable spending from investments (see “Determining Withdrawal Rates Using Historical Data” in the October 1994 issue of the Journal). But as mortality improves over time, this planning horizon is becoming less conservative, even for single individuals. A 30-year time horizon (age 95) is no longer so conservative (especially for non-smokers). Perhaps a 35- or 40-year retirement horizon is a better default assumption today.
Managing Longevity Risk
There are two general methods for managing longevity risk. The first is to decide on a conservative planning age. The more fearful a client is of outliving their assets, the higher the planning age they will likely be comfortable using. However, an increased planning age means having to spend less in order to draw out assets for a longer period of time.
The second method is to pool longevity risk with others. Everyone in the pool agrees that if they die early, part of their contributions to the pool will fund payments to those who live longer. For those who fear outliving their assets, admittance to the pool provides an opportunity to spend more than otherwise, as everyone can receive an income calibrated much closer to living to life expectancy, rather than to some age far beyond life expectancy. This is, of course, the basis for defined-benefit pensions and income annuities.