Journal of Financial Planning: November 2015
Arthur T. Cox, Ph.D., is an associate professor of finance in the department of finance and the director of the Center for Real Estate Education at the University of Northern Iowa. His interests include real estate valuation and finance, agency, and real estate development.
Richard A. Followill, Ph.D., is a professor of finance in the department of finance at the University of Northern Iowa. His interests include derivatives, real estate, inventory models, and market efficiency.
Brett C. Olsen, Ph.D., is an assistant professor of finance in the department of finance at the University of Northern Iowa. His research interests include corporate governance, ownership structure, valuation, and real estate.
Executive Summary
- One of the complexities of the new home mortgage decision is whether or not to pay up-front points to secure a lower loan rate.
- Few home buyers have the mathematical expertise to evaluate this decision, and even for those who do, running the numbers can be a daunting and tedious task.
- This paper develops and explains an algorithm that can be used by financial planners to advise their clients regarding the mortgage rate buy-down decision.
- The model can be an effective tool when advising clients as to whether a particular mortgage buy-down offer makes economic sense within a present value framework.
A mortgage rate buy-down involves a cash payment in return for a reduced mortgage interest rate. Most buy-downs involve the payment of points. The payment of a point is considered a form of prepaid interest at the outset of the mortgage in exchange for a lower note rate.
Although this study does not focus on the various reasons why new homeowners might choose a mortgage rate buy-down, the most common reasons are briefly listed here to provide context for financial planners who may be called upon to provide guidance to their clients.
Some home buyers may see a rate buy-down as a way to lower monthly payments, potentially making it easier to qualify for a mortgage. A borrower may be unable to qualify for a mortgage at market interest rates but would be able to qualify with the lower payments generated by a reduced rate. The seller may, as an inducement to the buyer, pay the points necessary to reduce the mortgage rate and lower monthly payments. For studies analyzing the effects of seller-paid points on the home purchase price, see Agarwal and Phillips (1983) and Asabere and Huffman (1997; 2008).
Another reason buyers may wish to buy-down the note rate is to accelerate the mortgage interest tax shield arising from the mortgage interest tax deduction (Kau and Keenan 1987). The amount paid for the rate buy-down on a new home is considered prepaid interest and can be fully deducted in the first year of the life of the mortgage. This advantage exists only for new mortgages rather than refinanced mortgages. Refinanced mortgages require the buy-down cost to be amortized over the life of the mortgage (Gardner and Clark 2003).
In general, buyers with longer expected mortgage holding periods or buyers with higher refinancing costs are more likely to pay points to obtain a lower note rate (Basciano, Jackson, and Grayson 2008; Chang and Yavas 2009). There is, however, evidence that the payment of points is inversely related to borrower sophistication, and the payment of points to secure a lower mortgage rate is less common for borrowers who have a college education (Woodward 2003; Campbell 2006).
Evaluating the Buy-Down Decision
Lesseig and Fulmer (2003) analyzed mortgage maturity and rate buy-down decisions under the assumption that the mortgage may not be held to term. With respect to paying points for a reduced mortgage rate, these authors noted that changing the borrower’s tax rate has little effect on the rates of return for the buy-down decision. The current study confirms this insight.
The analysis builds on the work of Gardner and Clark (2003) who presented an in-depth analysis of the mortgage rate buy-down decision. Gardner and Clark advocated calculating a payback period, but they cautioned that the simplistic approach taken by many borrowers ignores the reduction in interest that can be deducted in the future, the difference in the rate of amortization for the two alternatives, and an adjustment for the time value of money. They argued that financial planners need to develop customized spreadsheets to correctly analyze the buy-down decision.
Constructing a customized spreadsheet for each individual situation, however, is a difficult and time-consuming process. The purpose of this study is to incorporate the observations of thousands of buy-down scenarios into an algorithm that financial planners can use to effectively counsel their clients who are contemplating a mortgage rate buy-down in conjunction with a new home purchase.
Quantifying the Mortgage Rate Buy-Down Decision
The payment of points, where one point represents 1 percent of the original loan, will reduce a loan payment amount so as to produce a positive net present value (in most cases) if the holding period of the mortgage is long enough. The following variable definitions are provided as a reference for future calculations:
PAT after-tax points paid to secure the rate buy-down
pmto monthly payment on the original mortgage
pmtb monthly payment after the rate buy-d
wn
Io initial interest rate on the original mortgage (the monthly rate, io, is Io /12)
Ib the interest rate after the buy-down, Ib < Io (the monthly rate,
ib, is Ib /12)
n the number of months to term
h the mortgage holding period in months
alo the balance of the original mortgage at the end of the holding period, h
Balb the balance of the buy-down mortgage at the end of the holding period, h
k the discount rate (an annual rate divided by 12)
T the marginal tax rate
The calculation of the net present value (NPV) of the rate buy-down decision involves four components: (1) the after-tax costs of the rate buy-down; (2) the present value of the monthly savings resulting from a lower mortgage payment due to the lower note rate; (3) the present value resulting from the difference in amortization rates because the lower interest rate mortgage amortizes more quickly; and (4) the present value of the forgone tax shield that results from paying a lesser amount of tax deductible interest.
In order to secure a lower rate, the mortgagor must agree to pay a percentage of the loan amount, which is tax deductible. The after-tax cost of a rate buy-down, PAT, equals the points paid multiplied by 1 – T. The present value of monthly savings resulting from the rate buy-down can be calculated with the following formula:

The holding period for the original mortgage and its rate buy-down replacement are equal; however, the two mortgages will amortize at different rates. The rate buy-down mortgage will amortize more quickly than the original mortgage. The present value of the net payoff balances of the two mortgages will make a positive contribution to NPV, which is computed as follows:

The balances for the original and buy-down mortgages follow the same general form:

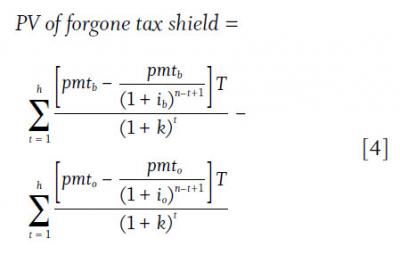
The present value of the forgone tax shield can be found by subtracting the present value of the stream of interest tax deductions on the original mortgage from the similar stream of interest tax deductions on the rate buy-down mortgage. The interest tax shield on the original mortgage is always larger than the rate buy-down mortgage, therefore this component will always be negative for any tax rate (T) above 0 percent. NPV will be reduced accordingly.
PV of forgone tax shield =
Incorporating these four elements into the NPV equation yields:

Employing the NPV Formula
The first three components of the NPV formula in equation 5 are relatively easy to compute using standard annuity formulas. The final element, the present value (PV) of the forgone tax shield, is far more difficult because the proportions of interest and principal in a fixed payment mortgage vary with every mortgage payment. This complication has led studies of the similar mortgage refinancing decision to resort to iterative solution procedures that require computer spreadsheets for evaluation.
In order to produce the thousands of buy-down NPV scenarios necessary to discover the relationships behind the algorithm to estimate discounted payback periods, a closed-form expression for the present value of the forgone tax shield was developed for this study. The presentation of this closed-form solution is beyond the scope of this study, but it is available from the authors by request.
The choice of the discount rate, k, has an obvious effect on NPV. Many mortgage refinancing studies advocate using the new mortgage rate as the appropriate discount rate, which in this case would be the lower buy-down rate. Although the reasoning for this selection is sound, the original mortgage rate to discount future cash flows was used throughout this study because this rate is more consistent with the required return on an asset with equivalent risk. Unlike the original mortgage rate, the buy-down rate is somewhat artificial in that it must be secured by an up-front payment. It should be noted, however, that the discount rate used will vary dramatically when different interest rate environments are examined.
The model computes NPVs for various buy-down scenarios, but the focus is on discounted payback periods rather than NPVs. The number of months it takes to recover the initial investment, in terms of present value (discounted payback period), may be a far more intuitively appealing measure for most clients than is NPV. NPV is very dependent on the holding period, a factor over which mortgagors have some control and are in the best position to estimate. In addition, most clients will want to know how long it will take for them to break even if they accept the mortgagee’s buy-down offer.
For these reasons, two measures were calculated: (1) break-even, which is the well-known discounted payback period, or the number of months necessary to secure a zero NPV; and (2) break-even plus return of investment (RoI). The break-even plus RoI measure computes the number of months for a homeowner to recoup the original investment twice over. For example, if a rate buy-down requires an after-tax investment of $1,000, the break-even plus RoI is the number of months that elapse before the NPV equals $1,000.
This study examined thousands of NPV scenarios. Three relationships became evident that roughly hold for most rate buy-down offers. These insights are presented below.
Proportionality
The investment required for a rate buy-down offer is completely separate from other costs such as appraisal, title search, and other closing expenses. As such, the size of the mortgage is not important to the decision. If, for example, a mortgagor pays one point to reduce her mortgage rate by 1/2 percent, the NPV for a $200,000 mortgage will be exactly twice as large as the NPV for a $100,000 mortgage for any given holding period, but the discounted payback periods will be exactly the same.
However, consider a mortgagor who is offered two proposals for the same mortgage: (1) pay one point for a 1/2 percent buy-down or (2) pay two points for a 1 percent buy-down. Are the results proportional? In other words, is the NPV for proposal (2) twice the NPV for proposal (1)? The answer is no, but the outcomes are surprisingly close to proportional for situations with widely varying holding periods, marginal tax rates, and mortgage rate environments.
Figure 1 presents a typical graphic example for a $200,000, 7 percent, 15-year, fixed payment mortgage for a mortgagor in a 30 percent marginal tax rate. The four buy-down offers portrayed are exactly proportional, ranging from two points to secure a 1 percent rate buy-down to 1/4 point to secure a 1/8 percent rate buy-down.
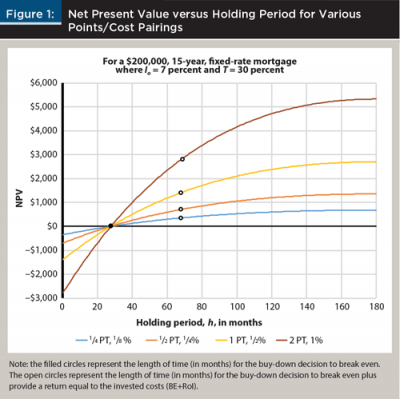
Although the NPVs vary substantially due to the differing sizes of the rate buy-down offers, the break-even points (discounted payback periods) all fall within the same month. The second time-related measure is also remarkably consistent in that the break-even plus RoI measures all fall within a range of two months.
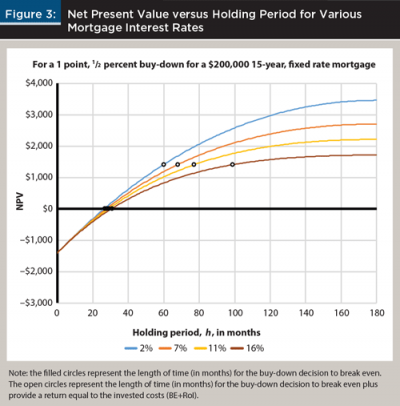
Note: the filled circles represent the length of time in months for the buy-down decision to break even. The open circles represent the length of time, in months, for the buy-down decision to break even plus provide a return equal to the invested costs (BE+RoI).
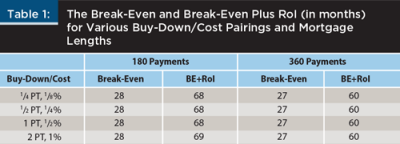
Table 1 provides the numerical results depicted in Figure 1, with additional results for a 30-year mortgage. Figure 1 and Table 1 show the analyses for only a few scenarios, but very similar results occur with many different scenarios. When examining the length of time to reach break-even or break-even plus RoI, there is very little variation with the size of proportional rate buy-down offers. This result is an important element of the rate buy-down analysis algorithm presented later in this study.
Tax Effects
The mortgagor’s marginal tax rate has a substantial effect on NPV, but surprisingly little effect on break-even periods. This is because two of the components of NPV—the initial rate buy-down cost and the forgone tax shield—play against each other. For example, because points are tax deductible when a new home is purchased, a buyer in a 0 percent tax bracket (or one who does not itemize) will pay twice as much for a given rate buy-down as will a buyer in a 50 percent tax bracket. The buyer in a 0 percent tax bracket will suffer no loss of tax shield, while the buyer in a 50 percent bracket most certainly will. The net effect is that for scenarios where the marginal tax rate is 50 percent or less, break-even discounted payback periods are fairly stable regardless of the tax rate.
Figure 2 depicts results for a $200,000, 7 percent, 15-year fixed payment mortgage for borrowers having marginal tax rates ranging from 0 to 45 percent. The rate buy-down proposal being examined is one point for a 1/2 percent reduction in the note rate.
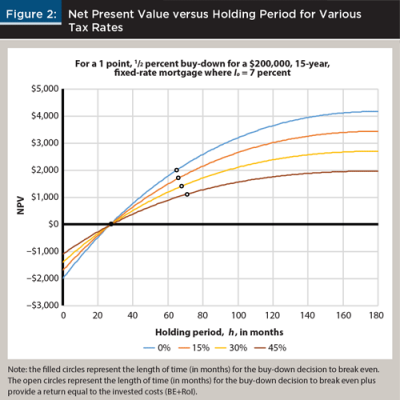
Table 2 provides the numerical results depicted in Figure 2, with additional results for a 30-year mortgage. For both 15-year and 30-year mortgages, break-even is very consistent at 27 to 28 months. There is greater variability in the break-even plus RoI measure, but the maximum range still falls within six months.

Interest Rate Environment
Suppose the mortgagor is offered one point for a 1/2 percent rate buy-down choice. Does it matter whether mortgage rates are relatively high or low? The savings provided by the difference in payments will be substantially greater in the high interest rate environment, but those higher differences must be discounted by a substantially higher discount rate. Again, the effect on the discounted payback period is fairly small.
Figure 3 depicts a $200,000, 15-year, fixed-rate mortgage for a mortgagor in the 30 percent tax bracket. Pre-buy-down mortgage rates range from 2 to 16 percent, and the buy-down proposal is one point for a 1/2 percent reduction in the note rate. Even over this wide spectrum of mortgage rates, the break-even is fairly consistent, ranging between 27 and 31 months. The range for the more volatile break-even plus RoI is 39 months. A very wide range of mortgage rates is presented here. If more historically normal rates, between 4 and 7 percent for instance, were examined, the break-even months would range between 27 and 28, and break-even plus RoI would range between 60 and 68 months. Table 3 presents the numerical data shown in Figure 3 with additional break-even months for a 30-year mortgage.

Various factors contribute to the NPV of a rate buy-down decision, including the size of the rate buy-down, the mortgagor’s marginal tax rate, the interest rate environment, the term of the mortgage, and the holding period.
The holding period is the most important factor to the mortgagor contemplating a rate buy-down, and the one factor over which he or she has a modicum of control. The scenarios presented in this paper show that the other factors have only a marginal effect on the determination of the break even and the break-even plus RoI periods. This insight allows construction of an algorithm that can help financial planners advise their clients regarding the attractiveness of various rate buy-down offers.
The Break-Even and Break-Even Plus RoI Algorithm
Financial planners can offer their clients advice on the attractiveness of a rate buy-down offer by following these steps:
Express a client’s buy-down offer as if it had a price equal to one point. If, for example, a client is offered a buy-down of 0.1 percent of the note rate at a cost of 1/3 of a point, assume the note rate could be reduced by 0.3 percent by paying one point. The approximate proportionality illustrated by Figure 1 and Table 1 allow for this transformation.
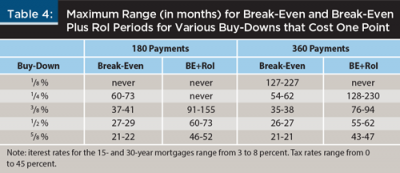
Ignore tax bracket and interest rate environment considerations. While these can substantially affect NPV, they do not have much effect on computed payback periods. Table 4 incorporates a wide range of tax rate and mortgage interest values to depict a large range of break-even calculations.
Consult Table 4 for a range of reasonable break-even approximations. Under a wide range of scenarios, Table 4 presents a range of months that will encompass the period when a client can expect to break even on a present value basis (break-even) and recoup the initial investment once again in terms of NPV (break-even plus RoI).
Even though the break-even and break-even plus RoI periods are fairly stable for reasonable buy-down scenarios, they do show some variation, especially for different tax and mortgage rate environment scenarios.
To construct Table 4, marginal tax rates were allowed to range between 0 and 45 percent. Initial mortgage rates range between 3 and 8 percent. Table 4 presents the widest possible range of break-even periods for various combinations of rate buy-down schemes given these tax and mortgage rate constraints. As with each of the examples in this study, NPVs and break-even periods were computed using a discount rate equal to the original mortgage rate (k = io).
Table 4 shows that the break-even period on a 15-year mortgage varies from a fairly attractive period of less than two years for a one point for a 5/8 percent buy-down to never reaching break even for a buy-down of 1/8 percent. The break-even plus RoI on a 15-year mortgage ranges from slightly less than four years on a 5/8 percent buy-down to as much as 13 years for a 3/8 percent buy-down. Buy-downs of one point for a 1/4 percent reduction in the note rate or less will never produce a break-even plus RoI period for a 15-year mortgage.
Break-even periods for 30-year mortgages are slightly less than for 15-year mortgages. Break-even on a 30-year mortgage with a one point for 5/8 percent buy-down is less than two years. Break-even plus RoI is less than four years for the same mortgage. Paying one point for a 1/8 percent buy-down on a 30-year mortgage, however, might take as long as 19 years to achieve break-even, whereas break-even plus RoI does not exist.
Conclusion
The algorithm presented here and exemplified by Table 4 (based on numerous scenarios generated by the NPV model) provides guidance for financial planners when offering advice to clients faced with a mortgage buy-down decision. Depending on the specific circumstances, the discounted payback period for a buy-down may range from less than two years to a period longer than the maturity of the mortgage, which is to say break-even is never achieved. More specifically, for the payment of one point to reduce the mortgage rate by 1/8 percent on a 15-year mortgage—a very common institutional offer—the buy-down never achieves a discounted payback, and the client will never break even. If one point buys down the note rate by 1/4 percent, the discounted break-even point is between four and a half and six years for a wide range of scenarios.
More generous buy-down scenarios will reach discounted break-even more quickly and provide the potential of recovering a present value equal to the original investment; however, these scenarios are rare in today’s mortgage rate environment. Definitely for scenarios that never break even, and quite likely for lengthy break-even periods, homeowners will be better served by applying potential buy-down costs to an increase in the down payment on their new home.
In summary, the algorithm presented in this study shows that various buy-down offers produce break-even and break-even plus RoI periods that fall within a fairly narrow range for most tax rate, mortgage term, and interest rate scenarios. Using this algorithm, financial planners can provide their clients with easy-to-understand advice on the mortgage rate buy-down decision.
References
Agarwal, Vinod B., and Richard A. Phillips. 1983. “The Effect of Mortgage Rate Buydowns on Housing Prices: Recent Evidence from FHA-VA Transactions.” AREUEA Journal 11 (4): 491–503.
Asabere, Paul K., and Forrest E. Huffman. 1997. “Discount Point Concessions and the Value of Homes with Conventional Versus Nonconventional Mortgage Financing.” Journal of Real Estate Finance and Economics 15 (3): 261–270.
Asabere, Paul K., and Forrest E. Huffman. 2008. “FHA/VA Financing and Price Discounts.” Journal of Real Estate Research 30 (2): 191–205.
Basciano, Peter M., Pamela Z. Jackson, and James M. Grayson. 2008. “Mortgage Choice: A Review of the Literature.” Journal of Personal Finance 7 (1): 42–67.
Campbell, John Y. 2006. “Household Finance.” Journal of Finance 61 (4): 1553–1604.
Chang, Yan, and Abdullah Yavas. 2009. “Do Borrowers Make Rational Choices on the Points and Refinancing?” Real Estate Economics 37 (4): 635–658.
Gardner, Randy, and John Clark. 2003. “The Decision to Pay Points When Borrowing.” Journal of Financial Planning 16 (4): 80–86.
Kau, James B., and Donald Keenan. 1987. “Taxes, Points, and Rationality in the Mortgage Market.” Real Estate Economics 15 (3): 168–184.
Lesseig, Vance P., and John G. Fulmer. 2003. “Including a Decreased Loan Life in the Mortgage Decision.” Journal of Financial Planning 16 (12): 66–70.
Woodward, Susan E. 2003. “Consumer Confusion in the Mortgage Market.” Sand Hill Econometrics Working Paper.
www.sandhillecon.com/pdf/consumer_confusion.pdf
Citation
Cox, Arthur, Richard Followill, and Brett Olsen. 2015. “Evaluation the Mortgage Rate Buy-Down Decision.” Journal of Financial Planning 28 (11): 42–48.