Journal of Financial Planning: May 2021
Luke Delorme, CFP®, has been the director of financial planning at American Investment Services in Great Barrington, Mass., since 2016. He received a bachelor’s in economics (2004) and an MBA from Boston College (2012). He has previously worked in economic research, banking, and consulting.
NOTE: Click on images below for PDF versions.
Investment professionals are presumably familiar with portfolio rebalancing and employ some type of rebalance strategy. Rebalancing is the act of returning a portfolio to its “target” allocation to keep portfolios near an expressed risk preference.
Rebalancing is necessary because portfolios drift from targets over time. As an example, an investor who started a 60/40 portfolio in July 2008 and never rebalanced would have more than 75 percent in stocks just 10 years later. This would clearly represent a riskier portfolio than originally implemented.
Rebalancing serves two distinct functions:
(1) Risk management. Rebalancing trades will sell asset classes that have gained in relative weight and buy those that have lost relative weight. When stock prices are rising, this means that rebalancing trades will sell stocks and buy bonds, thereby reducing risk in a portfolio.
(2) Portfolio recovery. Rebalancing may help portfolios recover after a bout of financial turbulence, such as that seen in the first half of 2020. During these periods, rebalancing trades will generally be selling bonds or gold to buy stocks. As the stock market recovers, this potentially helps the portfolio to recover to pre-crisis levels more quickly.
This column looks at whether common rebalancing strategies helped portfolio performance and recovery in 2020. The purpose of this analysis is to validate the value of rebalancing, in general, and to evaluate the efficacy of common practices during the most recent bout of financial turbulence.
The Academic Benefit of Rebalancing
A 2008 Daryanani paper in the Journal of Financial Planning suggests that an optimal rebalancing strategy can boost returns.1 This is intuitively appealing since rebalancing entails “selling high and buying low.” Daryanani (2008) looked at the sample period from 1992-2004 and found optimal rebalancing practices on a portfolio consisting of five asset classes could have boosted returns by an annualized 0.45 percent during the sample period. This optimal solution was the result of reviewing allocations every 10 trading days and trading when an asset class was outside of a +20/–20 percent tolerance band.
A follow-up paper by Marlena Lee (2008) found that the results of the Daryanani paper were heavily dependent on the time frame used for analysis.2 Lee (2008) found instead that the potential increase in returns is not statistically different from zero and is dependent on the data sample. This also makes intuitive sense because rebalancing typically entails selling assets with higher expected returns (stocks) and buying assets with lower expected returns (bonds).
Most recently, Moisand and Salmon (2020) looked at whether “aggressive” rebalancing during bear markets allowed portfolios to recover more quickly.3 Moisand and Salmon (2020) asked whether rebalancing to a more aggressive target after a bear market further boosted performance—the idea that if some rebalancing is good, more rebalancing could be better. Looking back at the admittedly small sample of bear markets, the authors found mixed results and that rebalancing to a more aggressive portfolio during bear markets did not “substantially” improve outcomes, except in cases of severe bear markets (–40 percent or worse).
Rebalancing certainly provides a disciplined way to maintain a consistent risk exposure. In addition, there are historical periods when rebalancing would have increased returns. However, it is not clear from the research whether a rebalanced portfolio can be expected to provide outsized returns over long periods.
Assumptions and Methodology
For this column, a simple rebalance rule is used that rebalances all asset classes every time a single asset class is out of tolerance. Although this may create more trades than necessary, the declining cost of trading renders it feasible to follow this approach with minimal transaction costs.
This article uses daily data on mutual funds and ETFs for nine distinct holdings. It assumes a starting portfolio holding these nine positions in the weights shown in Table 1 as of January 1, 2020. The funds selected and portfolio structure are based on Dimensional Fund Advisors’ sample portfolios, with the addition of a 5 percent allocation to gold.
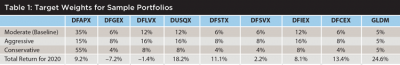
The funds used, initial weights, and total annual return for each fund are shown in Table 1.
Yahoo Finance was used to download adjusted closing prices for each of these funds from December 31, 2019, through December 31, 2020. Using adjusted closing prices inherently assumes that any dividend or income was re-invested.
The value of each position is calculated at the end of each day. That value is then translated into a percentage share of the overall portfolio.
Target weights are allowed to float by a pre-determined tolerance band. For example, the tolerance band may be +20/–20 percent. With such a band, the allocation to GLDM would be allowed to float between 4.0 percent and 6.0 percent of the overall portfolio.
At the end of each day, if any single position were outside of its tolerance band, a rebalance would be “triggered” and the entire portfolio would be rebalanced to target weights the following day. The buy and sell transactions would be based on prior day closing values, meaning that by the end of the trading day the portfolio would still be “off target” to the extent of daily price moves. This reflects the reality of trading mutual funds at end-of-day prices.
Each time a rebalance is triggered, a cost of 1.2 basis points is incurred on the portfolio (an assumption of eight mutual fund trades at $15 each on a $1 million portfolio). ETF spreads on GLDM are not included as a cost.
Each tolerance band between 10 percent and 35 percent was tested to see when rebalance trades would be triggered, and the hypothetical impact on returns over the period.
Taxes are ignored for this exercise. To the extent that tax-loss harvesting has the potential to improve relative after-tax performance over time, there may be added incentive to rebalance in conjunction with tax-loss work.
This analysis also does not consider asset location. Most planners practice some form of asset location, concentrating investments that are least tax efficient, such as REITs, in tax-deferred and tax-free accounts. Asset location may further improve after-tax performance of a portfolio over time versus the simple IRA portfolio that has been considered in this analysis.
Results and Interpretation
At the end of 2020, the unrebalanced moderate portfolio would have seen a total return of 8.60 percent. The relative underperformance versus the market is due to the use of dedicated small cap and value funds, as well as international diversification.
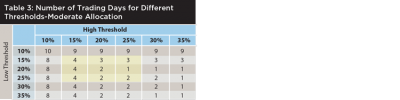
Table 2 nearby shows relative performance improvement for rebalanced portfolios versus the unrebalanced portfolio. Table 3 shows the hypothetical number of trading days for the different thresholds. Cells shaded in grey represent typical rebalance thresholds.
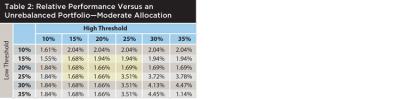
Rebalancing at any of the thresholds tested led to better performance during the sample period as compared with not rebalancing, even after accounting for transaction costs.
The rebalance threshold argued for in Daryanani (2008), +20/–20 percent, would have led to hypothetical outperformance of 1.66 percent in 2020. This threshold would have triggered only two rebalance days during the year—March 10 and December 24.
In some cases, different thresholds led to the same relative performance because hypothetical trades were triggered on the same days. For example, the +20/–25 and +20/–30 thresholds would have also led to only two trading days, the same as the +20/–20 threshold. In these cases, the low threshold was irrelevant because only the high threshold was triggered (gold on March 10 and small caps on Dec. 24).
Generally speaking, thresholds between 15 and 25 percent, which are common practice among planners, seemed to perform well during the sample period and required only two to four trading days. This clearly represents an opportunity for planners to point to a value proposition for clients. These rebalancing thresholds can be monitored quite easily with the ubiquity of robust trading software.
Different Risk Levels
As a secondary analysis, starting weights representing “aggressive” and “conservative” portfolios were tested. The weights for these different portfolios were provided in Table 1.
For the aggressive portfolio, the unrebalanced performance was 8.15 for the year, slightly worse than the moderate portfolio, owing to the relative full-year underperformance of certain asset classes, as shown in Table 1. For these more aggressive portfolios, the +20/–20 percent threshold led to relative outperformance of 1.61 percent versus the unrebalanced portfolio, similar to the results for the moderate portfolio allocation.
For the conservative portfolio, the unrebalanced portfolio performance was 9.05 percent for the year. Again, relative performance was improved as a result of rebalancing. The +20/–20 percent threshold saw relative performance of plus +2.54 percent versus the unrebalanced portfolio.
Conclusions for Practitioners
The empirical findings from 2020 support the hypothesis that rebalancing generally helped portfolios recover after the downturn. Actual client results corroborate the results shown in this column’s analysis, even though individual portfolios are idiosyncratic, with cash inflows and outflows, and various starting weights.
Although model portfolios took several months to recover to pre-crisis levels, rebalancing generally resulted in improved relative returns and portfolios returning to pre-crisis levels more quickly, even after accounting for transaction costs. The portfolio recovery goal of rebalancing was achieved rather successfully in this instance.
Most investment professionals employ rebalancing thresholds between 15 and 25 percent. These thresholds generally did well and resulted in two to four trading days over the course of a turbulent year. Planners who employed thresholds in this range likely saw performance improve by 150 to 250 basis points versus not rebalancing at all.
There is no evidence from 2020 that any single threshold provided a far superior investment result, and even if it had, it would only be an artifact of the data.
The important takeaway for planners is that having a robust and disciplined rebalancing process is important—the specific details of the process are not. Rebalancing does not need to be subjective. Many planners may have delayed rebalancing or did not rebalance at all because of fear during the downturn. This analysis shows once again that rebalancing during the market downturns would have improved performance and portfolio recovery. Adopting and adhering to a strict rebalancing policy removes the behavioral impediment of fear. It may not be possible to find an optimal and precise rebalance threshold for all situations, but the range of thresholds that planners typically use appears reasonable.
Endnotes
- See “Opportunistic Rebalancing: A New Paradigm for Wealth Managers,” by Gobind Daryanani in the Journal of Financial Planning.
- See “Rebalancing and Returns,” Dimensional Fund Advisors research by Marlena Lee. Available online at citeseerx.ist.psu.edu/viewdoc/download?doi=10.1.1.625.3253&rep=rep1&type=pdf.
- See “Analyzing the Effects of Aggressive Rebalancing During Bear Markets,” by Dan Moisand and Mike Salmon in the Journal of Financial Planning.