Journal of Financial Planning: May 2019
Brian L. Betker, Ph.D., is a professor of finance at Saint Louis University and a registered investment adviser with experience advising institutional and individual investors.
Executive Summary
- This study examined the extent to which using information about the prior investment performance of a retiree’s assets when deciding whether to claim Social Security benefits can enhance the ability to provide for constant real consumption.
- Prior research examined the optimal claiming decision under the assumption that a newly retired 62-year-old makes an irrevocable pre-commitment to claiming Social Security at a fixed future date, and then assessed which claiming age was optimal.
- This study recognized the value of the option to look back at prior performance of the nest egg portfolio before deciding when to claim benefits.
- For single and married retirees with substantial savings, including the value of this “lookback” option in spending decisions allows them to consume between 2 percent and 5 percent more annually, compared to the claiming strategies examined in prior studies.
A new retiree must evaluate a complicated trade-off when trying to decide when to claim Social Security benefits. While the annual benefit increases by up to 8 percent per year as the claiming age is delayed from 62 to 70, the retiree will have to spend down their nest egg portfolio while waiting to claim the higher benefit. This decision has been analyzed by prior researchers, but most studies have assumed that a 62-year-old retiree pre-commits to claiming Social Security at (for example) either age 62, 66, or 70, and then assessed which claiming age was optimal. However, these analyses ignored a potentially valuable option held by the retiree.
Rather than assuming that a 62-year-old individual makes an irrevocable choice to either claim immediately, at age 66 or at age 70, this study recognized that upon turning age 66, a retiree can look back at the performance of their nest egg portfolio over the prior four years. The retiree then has the option to claim immediately, or wait four more years. If portfolio returns have been high over the prior four years, waiting until age 70 to claim the higher benefit may be optimal. But, if the nest egg has underperformed, it may not be able to withstand four more years of withdrawals while waiting to claim at age 70; so in this case, the retiree would decide to claim at age 66 rather than wait. Of course, the optimal decision depends not only on the prior investment performance of the retirement assets, but on the size of the original nest egg portfolio as well.
This study investigated the value of this “lookback” option, relative to the “static” strategy of pre-committing to claiming Social Security at a fixed future age. The value of the option was assessed using a Monte Carlo simulation that builds on the model of Alderson and Betker (2017). This model assumed that a newly retired individual has a simple objective: constant real consumption, to be funded by an initial amount of retirement savings and future Social Security benefits.1 The simulation incorporated current mortality rates and maximum Social Security benefits, and projected investment experience based on the history of asset returns and inflation.
The value of the lookback option was assessed in two ways. First, for each claiming strategy the model evaluated the probability that the retiree would exhaust his or her savings and be forced to limit consumption to what is provided by Social Security. The optimal strategy was the one with the lowest probability of asset exhaustion, or “failure probability.” Another way to assess the value of the option is to ask: by how much would a retiree have to reduce annual consumption so that the failure probability of the best static strategy was as low as the failure probability of the lookback strategy?
Claiming at age 66 or 70 (having retired earlier) while enjoying constant real consumption requires spending down tax-deferred assets while waiting to claim the higher Social Security benefit. The objective of this study was to examine whether a dynamic lookback strategy for claiming Social Security can reduce the probability that a retiree will exhaust their nest egg, relative to the static strategies employed in prior studies.
Literature Review
The question of when to claim Social Security benefits has been examined from several perspectives. Rose (2015) examined the return on investment to the delayed claiming of benefits, while Geisler and Hulse (2016, 2018) focused on how tax-efficient withdrawal strategies interacted with the decision to claim benefits. Alderson and Betker (2017) examined how delayed claiming affected the probability that the nest egg portfolio would be exhausted prior to death in a setting where longevity insurance was available. These four studies assumed that a 62-year-old retiree pre-committed to claiming at ages 62, 66, or 70 and assessed which claiming age was optimal.
Meyer and Reichenstein (2010, 2012) examined how claiming benefits at age 64, 66, 68, or 70 affected the present value of expected lifetime benefits and the longevity of tax-sheltered assets, assuming that the objective of the retiree was to maintain constant real consumption. Shoven and Slavov (2014a, 2014b) analyzed the optimal claiming strategy by comparing the value of the benefits foregone, versus the expected value of the increase in benefits due to delayed claiming, while Goda, Ramnath, Shoven, and Slavov (2018) explored the role of assets held in tax-advantaged retirement savings accounts in the decision to delay claiming. These papers simulated the gains from a delay in claiming benefits assuming various claiming ages ranging from 62 to 70. However, this set of papers again did not model the retiree’s ability to look back at the nest egg’s investment performance prior to deciding to claim benefits.
This paper’s contribution to the literature on claiming Social Security is that it recognized that new retirees aspiring to constant real consumption have another option. Rather than pre-committing at age 62 to claim benefits at a fixed future date, as time goes by, the retiree has the option to look back at the performance of their retirement assets before deciding to claim benefits. The study assessed the value of that option.
Social Security Benefits
The retirement benefit available from Social Security depends on both career earnings and the age at which benefits are claimed. The current full retirement age (for someone turning age 62 in 2018, the year this analysis was run) is 66 years and four months, and benefits may be claimed as early as age 62. Benefits are reduced if a retiree claims prior to age 66 and increased if claiming is deferred beyond age 66 up to age 70. In 2018, the maximum monthly benefit at age 62 was $2,158; at age 66 it was $2,788; and at age 70 the beneficiary received $3,698. Married individuals are eligible for the greater of half of the spouse’s benefit, or the benefit attributable to their own career earnings. When a spouse dies, the surviving spouse can receive the entire benefit of the deceased spouse, if it is larger than their own.
Methodology and Assumptions
The model used in this study built on the simulation developed in Alderson and Betker (2017). This study examined the implications of the decision to claim benefits at three different ages: 62 (the earliest allowable age); 66 (the current full retirement age); and 70 (the age at which benefit increments for delayed claiming stop). More than 75 percent of all persons filing for Social Security benefits in 2013 claimed at one of these three ages; more than one-third of retirees claimed at age 62 (Munnell and Chen 2015). The innovation in this study was to analyze the retiree’s option to claim at age 66 or to wait until age 70. The decision to exercise the option was conditional on the investment performance of the retirement assets between ages 62 and 66.
The model assumed that a retiree was eligible for the maximum Social Security benefit at any claiming age, which means that he had earned at least the maximum taxable earnings ($128,400 in 2018) subject to the old age, survivors, and disability insurance (OASDI) tax, in each of the prior 35 years. The study assumed that the retiree had accumulated tax-deferred savings in amounts ranging from $100,000 to $1 million, which includes most U.S. households ages 55 to 64 who have any retirement savings.2 Note that the model implicitly assumed that the retiree was not covered by a defined-benefit pension plan. However, the model can easily accommodate such a plan by adding the present value of expected defined-benefit pension plan payments to the retiree’s nest egg.
A retiree’s life was simulated 10,000 times in every scenario. In each “life” a year of death was assigned based on the current life tables used by the Social Security Administration, which estimate median life expectancies of about 85 years for males and 88 years for females. The retiree’s portfolio was assumed to be invested in a 60 percent/40 percent mix of large-cap U.S. stocks and long-term U.S. Treasury bonds. This mix consistently resulted in lower failure probabilities than other potential asset allocations.
For each year in a simulated life, returns to stocks and bonds, as well as inflation, were chosen by randomly drawing a year from the period 1926 to 2017. The model used two measures of inflation: the Consumer Price Index for All Urban Consumers (CPI-U), and the Consumer Price Index for Urban Wage Earners and Clerical Workers (CPI-W). Changes in annual consumption were linked to the CPI-U. Social Security benefits increased by the CPI-W when it was positive; otherwise they did not change. Bond, stock, and CPI-U values were gathered from Morningstar’s 2018 Stocks, Bonds, Bills, and Inflation Yearbook (SBBI), and the CPI-W for the year came from the St. Louis Fed’s FRED database (fred.stlouisfed.org).
An objection to these assumptions might be that future annual returns to stocks and bonds may be lower than their historical averages. In a world of lower asset returns, the 8 percent increase in annual benefits gained by deferring claiming would be more valuable, and should reduce the relative value of the lookback option. To address this issue, a new set of simulations reduced the historical yearly returns on both bonds and stocks by 3 percent each year, and both CPI-U and CPI-W were reduced by 1 percent each year. In these simulation runs, CPI-U averaged 1.98 percent, and the annual returns to bonds and stocks averaged 3.04 percent and 8.86 percent respectively. This means that the average real return to stocks and bonds declined by 2 percent, with no effect on the average annual equity risk premium.3
Retirement spending was modeled assuming that the retiree amortized their nest egg over their median remaining life span. Specifically, in the first year of retirement (at age 62), spending was set equal to the age 62 Social Security benefit, plus 1/N of the nest egg, where N was the retiree’s median remaining life span (to age 85 for men and 88 for women). With slight rounding, this is equivalent to following the 4 percent rule. In future years, annual spending was set equal to the prior year’s spending times one plus the CPI-U for that year, in order to achieve the goal of constant real consumption.
To illustrate, a male who retired at age 62 with a $500,000 portfolio would set initial consumption equal to the age-62 Social Security benefit of $25,896 plus 1/23 of his nest egg ($21,739) for total consumption of $47,635.
The model assumed that consumption expenditures (C) and Social Security benefits (S) were paid and received in the middle of the year. Thus the retiree’s wealth (W) at the end of any year t was:
Wt = [Wt–1 × (1+Rt) – Ct + St ]
× (1+Rt)
Where Rt is half the year’s return on the portfolio; that is, (1+Rt)2 equals one plus the annual return to the portfolio. If Wt was negative for any year prior to death, which meant that the nest egg portfolio was exhausted, the simulation run was termed a “failure.” If Wt remained positive for all years of the retiree’s life, the simulation run was deemed a “success.”
The study considered newly retired 62-year-old individuals and examined four different strategies for claiming Social Security. In the first three, the retiree pre-commits to claiming benefits at either age 62, 66, or 70 (these are the “static” claiming strategies evaluated in previous research). The fourth strategy allowed four years to elapse, at which point the now-66-year-old retiree assessed the performance of the nest egg over the prior four years and used this information to help decide whether to claim benefits at age 66 or wait four more years to claim at age 70. Of course, in this scenario the retiree needed a definition of what constitutes “poor performance” of the nest egg portfolio. Poor performance was defined as an average portfolio return over the prior four years that was lower than its historical average, based on the SBBI data going back to 1926.4
Results
The simulations produced failure probabilities for a 62-year-old retiree for each of four Social Security claiming strategies: claim at age 62; pre-commit to claiming at age 66 or 70; and the lookback strategy whereby the decision to claim at age 66 is conditioned on the nest egg portfolio’s performance over the previous four years. Results are presented for single retirees followed by the results for married couples.
Single retirees. First, consider the scenario in which a male5 retires at age 62, invests retirement savings in a 60/40 stock/bond portfolio, and either pre-commits to claiming benefits at age 62, 66, or 70, or decides to utilize his lookback option upon turning 66.
Table 1 contains the results of this exercise, using historical returns to simulate future returns. The table presents failure probabilities for the lookback strategy as well as for the best static strategy, which is the one with the lowest failure probability. For each wealth level, an asterisk indicates that one claiming strategy has a significantly lower failure probability than the other (in all tables the null hypothesis that the difference between any two probabilities is zero was tested using a binomial t-test). Recall that the retiree wishes to maintain constant real consumption over his remaining life span, and the table provides the probability that he will fail to achieve this goal.
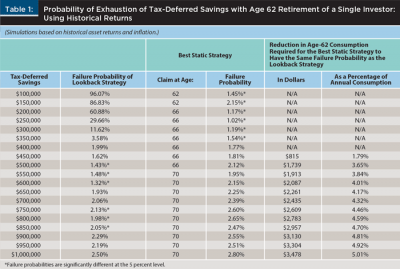
Table 1 indicates that a 62-year-old retiree with $150,000 or less in savings should claim Social Security immediately, as failure is a near certainty if claiming is delayed until age 66 or 70. The nest egg is simply too small to support four or eight years of withdrawals while waiting to collect a higher benefit.
For wealth levels between $150,000 and $400,000, claiming at age 66 was optimal, while for initial wealth levels between $400,000 and $450,000, claiming at age 66 and using the lookback strategy resulted in failure probabilities that were not significantly different.
For wealth levels above $450,000, the lookback option provided significant value for the retiree. At these wealth levels, the failure probability for the lookback strategy was lower than that of the best static strategy (although at higher wealth levels there were a few cases where the failure probabilities were not significantly different from the strategy of claiming at age 70).
These results can be viewed from another perspective by asking: by how much would a retiree need to reduce age-62 consumption so that the best static strategy has the same failure probability as the lookback strategy? This provides a measure of the value of the option to look back at prior portfolio returns before deciding to claim at age 66 or 70.
New simulations reduced initial (age 62) consumption until the failure probability of the best static strategy was not significantly different from the lookback failure probability reported in Table 1. The final two columns of Table 1 report the amount by which year-one consumption was reduced, both in dollars and as a percentage of the lookback strategy’s year-one consumption. Results are reported for wealth levels $450,000 to $1 million, because the lookback strategy was optimal only in this range.
Depending on the initial wealth level, the retiree would have to reduce age-62 consumption by 2 percent to 5 percent in order for the best static strategy to have a failure probability as low as the lookback strategy. Note that since consumption in subsequent years is simply inflation-adjusted age-62 consumption, this 2 percent to 5 percent reduction in spending would occur in every year of retirement.
Example. To illustrate, consider a retiree with a nest egg of $600,000. According to Table 1, the best static strategy is to pre-commit to claiming at age 70, for a failure probability of 2.15 percent. In contrast, employing the lookback strategy resulted in a significantly lower failure probability of 1.32 percent. Age-62 spending using the lookback strategy consists of the age-62 Social Security benefit of $25,896 plus 1/23 of the nest egg, or $51,983. In order for the static claim-at-age-70 strategy to have a failure probability as low as 1.32 percent, age-62 spending must be reduced to $49,896—a reduction of $2,087, which is equal to 4.01 percent of $51,983.
Table 2 presents the results of the simulation in the low future returns scenario. The optimal claiming strategy at any given wealth level did not change significantly from Table 1. As expected, however, the value of the lookback option was reduced in these simulations. In a world of lower future returns, the relative value of claiming at 70 and getting a guaranteed 8 percent annual return for waiting, will be higher. As an example, the retiree with a $600,000 nest egg referred to earlier would only need to reduce age-62 consumption by 2.1 percent so that the failure probabilities of the claim-at-age-70 and lookback strategies were identical.

Married couples. Recall that the Social Security survivorship benefit awards the surviving spouse (which will be the wife, on average) with the benefit of the deceased, if higher than her own. The simulation examined whether using the lookback option in conjunction with the couple’s claiming decision can reduce the probability of exhausting the nest egg portfolio. The importance of this question is highlighted by Diebold, Moulton, and Scott (2017), who found that delayed claiming on the part of the husband was associated with a significant decrease in the likelihood that his widow would enter poverty in widowhood. Sass, Sun, and Webb (2013) also found that most husbands claim Social Security too soon, reducing the present value of their widow’s expected benefits and increasing their risk of poverty.
To accommodate married couples, this set of simulations assumed that both spouses retired at 62 and the wife claimed Social Security immediately. The husband then had to decide when to claim: age 62, 66, or 70. First-year consumption was set to two times the age-62 Social Security benefit, plus 1/23 of the couple’s retirement assets. Upon the death of one spouse, the next year’s consumption was set to one-half of consumption in the prior year.6
Table 3 reports the results when using historical returns to simulate future returns. Here, the range of wealth levels where the lookback strategy was optimal was narrower, due to the value of the survivor benefit. The lookback option was most valuable at wealth levels where claim-at-age-66 tended to be the best static strategy. Rather than automatically claiming at age 66 (thereby locking in a lower survivor benefit), the couple benefited by looking back at past portfolio returns. In scenarios where portfolio returns between ages 62 and 66 were above average, the male should delay claiming until age 70, thus locking in the maximum survivor benefit. The higher expected survivor benefit for the wife outweighed the negative effect of four more years of spending exclusively from the nest egg portfolio. The nest egg was better positioned to withstand the additional spending due to its above-average performance in the prior four years.
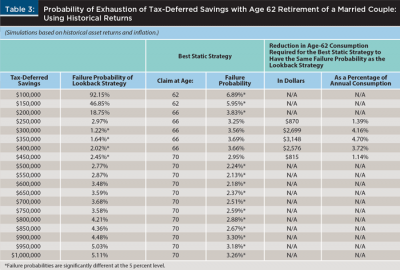
At wealth levels above $500,000, the static strategy of claim-at-age-70 is optimal. This strategy pre-commits to locking in the maximum survivor benefit for the wife. It dominates the lookback strategy in these cases, because here it would be a mistake to claim at age 66 just because the portfolio underperformed in the prior four years. At these wealth levels, the portfolio is large enough to withstand this underperformance, and ensuring the highest possible survivor benefit becomes the paramount concern.
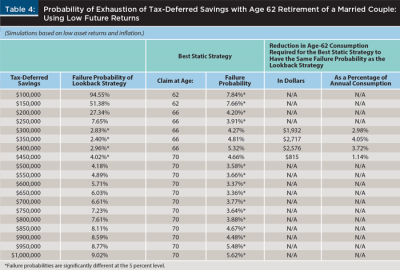
Table 4 presents results for married couples in the low returns scenario. As in Table 3, the lookback strategy was generally preferred when the best static strategy would be to automatically claim at age 66. Although the value of the lookback option was reduced slightly in these simulations, the reduction in value is not as great as seen between Table 1 and Table 2 for a single individual. The value created by achieving the highest possible survivor benefit, while still maximizing the likelihood of constant real consumption, was relatively unaffected by future return assumptions.
Implications for Financial Planners
Retirees own a valuable option that prior research has not recognized when assessing the optimal strategy for claiming Social Security benefits. When considering a 62-year-old retiree, prior studies assumed that the individual makes an irrevocable decision to claim benefits at a given future age (for example, 62, 66, or 70) and then analyzed which claiming age was optimal. However, upon turning age 66, this retiree has an option to look back at the performance of his or her retirement portfolio over the preceding four years, and then use that information when deciding to claim at age 66 or wait four more years. This paper assessed the benefits of utilizing that option. Results were presented in terms of an easy-to-explain decision rule that can be readily implemented by financial planners who are advising clients as to when to claim benefits.
According to this analysis, for single retirees with initial (age 62) retirement portfolios larger than $400,000, the optimal strategy is to claim benefits at age 66, if their average portfolio return over the prior four years has been lower than the historical average on that portfolio. However, if the portfolio has earned an above-average return over that time, the retiree can likely afford to wait four more years and claim the maximum benefit at age 70. Intuitively, poor performance of the nest egg portfolio between ages 62 and 66 means that it cannot withstand four more years of withdrawals while waiting to claim Social Security benefits at age 70.
The benefits of the lookback strategy were expressed in terms of lower failure probabilities; that is, the probability that the retiree will exhaust the nest egg portfolio prior to death. The benefits can also be quantified in a way that may be more intuitively appealing to retirees by asking: by how much would the retiree have to reduce annual consumption so that the failure probability of the best static strategy was as low as the failure probability of the lookback strategy? The study found that a single retiree with an initial nest egg greater than $400,000 can consume between 2 percent and 5 percent more in each year of retirement (depending on initial wealth levels) using the lookback strategy, while holding failure probabilities constant.
For heterosexual married couples, using the lookback strategy is valuable because it increases the number of scenarios in which the male can claim benefits at age 70, thus attaining the highest possible expected survivor benefit for his wife, who will outlive him on average. For married couples with nest eggs between $250,000 and $500,000, the lookback strategy dominated the strategy of automatically claiming at age 66 or 70.
This study highlighted the importance of looking back at recent investment performance before deciding to advise a client to claim Social Security benefits. If the client’s portfolio has performed well, a planner can have more confidence in the recommendation to delay claiming, thus providing the client with the guaranteed 8 percent return for waiting, and, for married couples, locking in a higher expected spousal benefit for the wife.
Future research on this topic might examine how a lookback strategy interacts with another option held by an individual retiree: the option to suspend Social Security benefits after they have been claimed. While suspended, benefits increase by 8 percent per year just as if they had never been claimed. This option is available once an individual retiree reaches full retirement age (currently 66) and it is likely that a decision to “claim and suspend” would be more beneficial following a period of strong nest egg portfolio performance.
Endnotes
- Constant real consumption as a goal of the retiree is implicit in the 4 percent rule (Bengen 1994) whereby 4 percent of the nest egg is consumed in the first year of retirement, and inflation-adjusted withdrawals are made each year after that. Consumption smoothing as an objective can be traced back to Fisher (1930) and is a central tenet of Franco Modigliani’s life cycle hypothesis of consumption and saving (Modigliani and Brumberg 1954). Kotlikoff and Burns (2008) argued that retirement portfolios should be managed to provide smooth lifetime consumption.
- According to a May 2015 GAO report (gao.gov/assets/680/670153.pdf), households at the 90th percentile of savings have amassed a nest egg of about $718,000. Simulation results for initial wealth levels above $1 million did not differ in any meaningful way from the results for a $1 million portfolio.
- Although these adjustments are ad hoc, the inflation and bond figures are consistent with recent U.S. experience. The U.S. inflation rate for the 12 months ended June 30, 2018 was 2.8 percent, while the 30-year T-bond yield was 2.98 percent on June 30, 2018. A 5.8 percent equity risk premium is consistent with the survey evidence in Fernandez, Pershin, and Acin (2018). And, qualitative conclusions about a low return environment were unchanged if these values were varied slightly.
- Several variations on this rule were examined, of the form “claim Social Security at age 66 if average portfolio returns over the past four years were less than x percent of their historical average, otherwise claim at age 70.” Values of x ranging from 0 percent to 75 percent did not yield results that were qualitatively different from the base case assumption of x = 100 percent.
- All simulations were run on the assumption that the individual was a female who amortized her assets to the end of her median life expectancy of 88 years. No substantive conclusions from Tables 1 and 2 changed as a result.
- The model thus assumed that each spouse had their own separate earnings history and was eligible for their own Social Security benefit. Variations of the model, wherein the female earns a lower benefit than the male, and where household expenses only fall by 25 percent rather than 50 percent upon the death of the first spouse, did not significantly affect any conclusions regarding the optimal claiming age of the male as reported in Tables 3 and 4.
References
Alderson, Michael J., and Brian L. Betker. 2017. “Does the Benefit of Deferring Social Security Offset the Opportunity Cost to Do So?” Journal of Financial Planning 30 (9): 38–47.
Bengen, William P. 1994. “Determining Withdrawal Rates Using Historical Data.” Journal of Financial Planning 7 (4): 171–180 .
Diebold, Jeffrey, Jeremy Moulton, and John Scott. 2017. “Early Claiming of Higher-Earning Husbands, the Survivor Benefit, and the Incidence of Poverty Among Recent Widows.” Journal of Pension Economics & Finance 16 (4): 485–508.
Fernandez, Pablo, Vitaly Pershin, and Isabel Fernandez Acin. 2018. “Market Risk Premium and Risk-Free Rate Used for 59 Countries in 2018: A Survey.” IESE Business School working paper, available on SSRN at ssrn.com/abstract=3155709.
Fisher, Irving. 1930. The Theory of Interest. New York, N.Y.: MacMillian.
Geisler, Greg, and David Hulse. 2016. “The Taxation of Social Security Benefits and Planning Implications.” Journal of Financial Planning 29 (5): 52–63.
Geisler, Greg, and David Hulse. 2018. “The Effects of Social Security Benefits and RMDs on Tax-Efficient Withdrawal Strategies.” Journal of Financial Planning 31 (2): 36–47.
Goda, Gopi S., Shanthi Ramnath, John B. Shoven, and Sita Nataraj Slavov. 2018. “The Financial Feasibility of Delaying Social Security: Evidence from Administrative Tax Data.” Journal of Pension Economics & Finance 17 (4): 419–436.
Kotlikoff, Laurence J., and Scott Burns. 2008. Spend ‘Til the End: Raising Your Living Standard in Today’s Economy and When You Retire. New York, N.Y.: Simon and Schuster.
Meyer, William, and William Reichenstein. 2010. “Social Security: When to Start Benefits and How to Minimize Longevity Risk.” Journal of Financial Planning 23 (3): 49–59.
Meyer, William, and William Reichenstein. 2012. “How the Social Security Claiming Decision Affects Portfolio Longevity.” Journal of Financial Planning 25 (4): 53–60.
Modigliani, Franco, and Richard H. Brumberg, 1954. “Utility Analysis and the Consumption Function: An Interpretation of Cross-Section Data,” in Kurihara, K. K., ed., Post-Keynesian Economics, New Brunswick, N.J.: Rutgers University Press.
Munnell, Alicia H., and Anqi Chen. 2015. “Trends in Social Security Claiming.” Center for Retirement Research at Boston College Issue Brief 15-8, available at crr.bc.edu/briefs/trends-in-social-security-claiming.
Rose, Clarence. 2015. “The Return on Investment for Delaying Social Security Beyond Age 62.” Journal of Financial Planning 28 (4): 50–58.
Sass, Steven A., Wei Sun, and Anthony Webb. 2013. “Social Security Claiming Decision of Married Men and Widow Poverty.” Economics Letters 119 (1): 20–23.
Shoven, John B., and Sita Nataraj Slavov. 2014a. “Does It Pay to Delay Social Security?” Journal of Pension Economics and Finance 13 (2): 121–144.
Shoven, John B., and Sita Nataraj Slavov. 2014b. “Recent Changes in the Gains from Delaying Social Security.” Journal of Financial Planning 27 (3): 32–41.
Citation
Betker, Brian L. 2019. “What Is the Value of a “Lookback” Strategy for Claiming Social Security?” Journal of Financial Planning 32 (5): 48–55.