Journal of Financial Planning: May 2011
Mark W. Riepe, CFA, is senior vice president of Schwab Center for Financial Research in San Francisco, California (a division of Charles Schwab & Co. Inc., member SIPC 0005-7185).
Michael Iachini, CFA, CFP®, is managing director of ETF Research at Charles Schwab Investment Advisory.
When trading any exchange-traded security, whether an individual stock or an exchange-traded fund (ETF), investors should always pay attention to the liquidity of the security. For an individual investor trading small numbers of shares, the main measure of liquidity is the difference between the price at which market makers are willing to buy the security (the lower “bid” price) and the price at which market makers are willing to sell (the higher “ask” or “offer” price). Conventional wisdom dictates that the more volume in a particular security, as measured by the value of shares changing hands in a typical day, the narrower the “spread” between the bid and ask prices will be.
In this article, we examine this relationship to see whether it holds true for ETFs. Using data from ArcaVision, we examine whether ETFs with higher trading volumes tend to have tighter bid-ask spreads and whether this varies across quarters or across asset classes. We find that there is indeed a strong log-linear relationship between spreads and dollar volumes and an equally strong log-linear relationship between spreads and total ETF assets.
Data
Bid-ask data for this study comes from ArcaVision. We queried the database of ETFs that existed as of February 2011, and downloaded average bid-ask spread and dollar volumes for all ETFs in that universe for each quarter from Q1 2008 through Q4 2010 (three years). The ArcaVision averages represent the bid-ask spread for each trade throughout the quarter, weighted by the share volume of each trade. We combined this information with end-of-quarter assets under management each quarter for each ETF based on data from Morningstar.
In addition, we repeated the analysis for that portion of the ETF universe for which NYSE Arca trading represented at least 25 percent of the ETF’s total trading volume, in order to remove any bias from small trading samples. The results did not differ meaningfully.
The number of ETFs studied increased from 544 at the beginning of the period to 912 at the end. These broke down to approximately 31 percent sectors, 24 percent U.S. diversified stock, 22 percent international stock, 11 percent bond, 10 percent alternative, and 3 percent balanced ETFs.
Note that the data are subject to survivorship bias, meaning that an ETF had to have been in existence throughout the entire period studied, and issues such as changes in ETF ticker symbols over time can lead to missing observations. In addition, the bid-ask data represent only those trades that were conducted on the NYSE Arca exchange, which is the main exchange for many ETFs but does not have a monopoly on ETF secondary market trading.
Analysis
To analyze the data, we examined the correlation between an ETF’s average bid-ask spread during a given quarter and its dollar volume and total assets. We also examined the correlation between the spread and the natural logarithm of the dollar volume and total assets, in an effort to identify a non-linear relationship. We also subdivided the universe of ETFs into diversified U.S. stock, sectors, international stock, bond, and alternative, to investigate whether the spread relationship differed across asset classes. The number of ETFs in the balanced asset class was deemed too small to be statistically significant as an independent asset class for this study.
Results
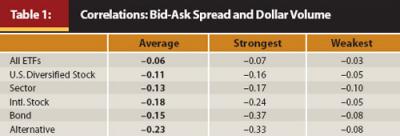
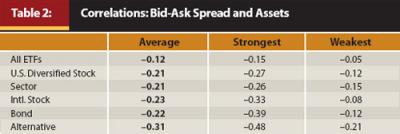
The overall relationships between an ETF’s bid-ask spread and both its dollar volume and its assets under management are clearly negative (as expected) and log-linear. The correlation is somewhat stronger with volume than with assets, but the difference is small. Unsurprisingly, the correlation between the log of assets and the log of volume is very high, in the neighborhood of 0.9. Thus, the ETFs with the most volume tend to also be the ETFs with the most assets.
The correlation between the straight (rather than logarithm) assets or volume and bid-ask spread is negative, as expected, but much weaker than the logarithmic relationship. (See Tables 1–4.) This is because there is a significant drop-off in spreads between ETFs with very small volumes and assets and ETFs with somewhat larger volumes and assets, but eventually that relationship subsides as volumes and assets increase. In other words, this is a non-linear relationship. Thus, the difference in spread between an ETF that trades $400,000 per day and an ETF that trades $500,000 per day is much greater, for instance, than the difference between an ETF that trades $2.2 million per day and one that trades $2.3 million per day. We can account for that by taking the logarithm of volume or assets, and doing so reveals a much tighter relationship.
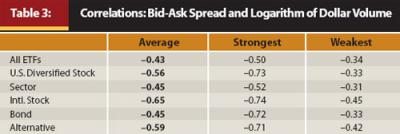
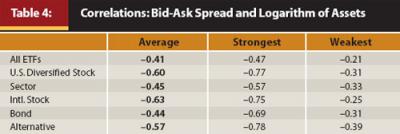
Variations in this relationship across ETF asset classes exist, but they are relatively small. The explanatory power of volume and assets on bid-ask spread is comparatively stronger for diversified U.S. equity, international equity, and alternative ETFs and somewhat weaker for sector and bond ETFs. This may be due in part to the wider variety of funds in the sector and bond asset classes: sector funds include U.S. and international sectors, industries, and sub-industries, while the bond asset class includes everything from short-term Treasury bonds to international and emerging market bonds to TIPS and high-yield bonds.
Time variation in these relationships over the three-year period under investigation appears minimal. There are some quarters with weaker-than-average relationships (notably the first quarter in the data set, Q1 2008) and some with stronger relationships, but there does not appear to be any strong trend in the relationship over time, nor does the market turmoil of the fourth quarter of 2008 appear to correspond to an especially strong or weak relationship between spreads and either volume or assets.
Conclusion
Conventional wisdom holds that securities with higher trading volume will have tighter bid-ask spreads, and this appears to be generally true for ETFs. The relationship is log-linear, indicating that the difference is more pronounced between low-volume and average-volume ETFs than between high-volume and extremely high-volume funds. The assets under management in the ETF also serve as a good proxy for dollar volume in this study, as the results appear equally strong for the relationship between assets and bid-ask spread. It is important to pay attention to volume and assets when selecting an ETF, but once you have screened out the lowest-volume and smallest-asset funds, the importance of these factors in determining the spread is diminished.
It is also important to note that this study looks solely at the secondary ETF trading market, which is where smaller-balance investors are likely to trade. Institutional investors are likely to trade, either directly or indirectly via authorized participants, in the primary market, creating and redeeming ETF shares. For those traders, the more important liquidity measure is the liquidity of the underlying securities within the ETF rather than the bid-ask spread of the ETF itself, which is beyond the scope of this study.