Journal of Financial Planning: March 2017
Chia-Li Chien, CFP®, PMP®, is a succession strategist at the Value Growth Institute. She is an instructor and CFP® program director at Ball State University. She can be reached at HERE.
Acknowledgement: The author thanks Melisande McCrae, Ph.D.; Tung Liu, Ph.D., and Wade D. Pfau, Ph.D., CFA, for helpful comments.
Executive Summary
- The purpose of this study was to provide an empirical review of an industry rule of thumb: what is the relationship between a financial planning practice’s selling revenue multiple and its revenue size?
- To successfully exit a financial planning practice, owners are required to meet industry compliance as well as their own retirement needs. To do so, they often rely on appraisers or financial intermediaries to facilitate the exit or succession transition.
- Results suggest that using specialized financial intermediaries favored sellers but not buyers. Financial statement items alone did not provide a complete picture of the fair market value. Industry adjustments such as the quality of a practice’s clients, the quality of the team, and the quality of the platform tend to reside only within specialized financial intermediaries.
- The study found that the revenue size of the financial planning practice did have a statistically significant effect on the selling price based on revenue multiple.
- The combination of large numbers of financial advisers reaching retirement age and the fact that most financial planning practices do not have succession plans in place, means the topic of succession planning remains an important one for the financial planning profession.
The combination of large numbers of financial advisers reaching retirement age and the fact that most financial planning practices do not have succession plans in place, means the topic of succession planning remains an important one for the financial planning profession.
Assuming an average retirement age of 68, an estimated 8,600 financial advisers will reach retirement age each year for the next several years, according to Cerulli.1 The industry surveys highlighted in this paper (see Table 2) show that just 25 percent to 38 percent of financial planning firms have a succession plan in place. To successfully exit a financial planning practice requires the owner(s) to meet not only industry regulations, but also their own retirement needs.
Owners are typically not experts in valuations of their own practices; they are like other privately held business owners—they rely on reputable appraisers or financial intermediaries to provide a fair market value (FMV). FMV can be subjective. It depends on buying and selling market conditions, as well as how the practice was appraised and how the deal was structured.
Previous literature has indicated many rules of thumb in determining the FMV of a practice. But limited empirical studies have offered analysis of these rules of thumb to help owners determine their succession or exit needs. The purpose of this study was to provide an empirical analysis of one industry rule of thumb: what is the relationship between the selling revenue multiple for a financial planning practice and the revenue size of the practice?
This study used the following terminology and definitions:
A “specialist” is a financial intermediary who provides appraisal of a financial planning practice. The specialist often provides consultations in deal structures, negotiations, and assistance with transitions of a financial planning practice. Specialists, as defined here, have a niche in valuating financial planning practices and have experience with more than 60 deals.
A “generalist” is a financial intermediary who provides similar services to a specialist but who has experience with fewer than 60 deals and does not specialize in financial planning practices.
A “practice” is any financial planning practice that provides services in the area of comprehensive or modular financial planning, sells financial products such as investments or insurance, and provides advice or counseling.
A “platform” is a wirehouse, broker-dealer, or RIA channel with which the owner of a practice is affiliated. The owner(s) of a practice must comply not only with industry regulations but also with the platform’s rules when exiting a practice.
A “manufacturer” is a financial product manufacturer of mutual funds, exchanged-traded funds, life insurance, annuities, assets under management packages, and long-term care insurance.
A “solo practitioner” is a sole proprietorship; effectively a franchisee of the broker-dealer.
A “group of solo practitioners” is up to four solo practitioners who come together to run a business. They will likely split commissions and/or revenue share, but don’t necessarily have a fromalized business entity behind it.
A “practice enterprise” is a group of more than four practitioners who come together and create a cohesive financial advisory firm.
Literature Review
Maximizing satisfaction is a main assumption in utility theory, according to Browning and Finke (2016). It is logical to assume that practice owners want to get the most out of their practices as a return on investment from their years of hard work and that they want to use proceeds from selling the practice to potentially fund their retirement.
Financial planning practices commonly counsel their business-owner clients about succession and retirement income planning. Potts, Schoen, Loeb, and Hulme (2001a) found that 82 percent of practices indicated that owners of family businesses inherit complexity in their overall financial planning strategy. This complexity comes from the high concentration of illiquid business assets in the owners’ overall net worth. Business assets are not typically liquid, and book equity value is often different from market value. The book equity value can be found in the balance sheet of an owner’s business, but the market value, or actual sale price, is often determined through a variety of measures, including available qualified buyers, economic cycles or conditions, talent of employees, market share, viable future business models, etc.
Potts, Schoen, Loeb, and Hulme (2001b) identified the specific areas for the successful retirement of family business CEOs. Table 1 shows the top areas of importance based on a survey of financial planners who answered 62 questions concerning conditions that may be important to the successful retirement of family business CEOs. The questions were grouped into six categories. The readiness of a client plays a significant motivating role for effective retirement planning. However, retirement funding, which largely contributes to a client’s readiness, may depend on sales proceeds from exiting or succession strategies.
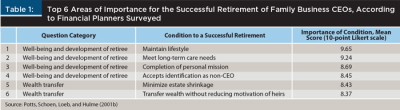
If a business-owner client relies on the business sale proceeds as part of retirement funding, then continuity and viability of the enterprise logically would be one key succession factor as far as the value of the clients’ assets. Yet Table 1 shows this key factor was not among the top areas of importance according to the planners surveyed. If financial planners do not counsel their clients to prioritize succession planning, by extension those same planners, especially those who are firm owners, may be unlikely to implement thoughtful succession strategies for their own practice.
Table 2 illustrates a variety of industry surveys of practices that have succession plans in place. A 2013 survey by the Financial Planning Association Research and Practice Institute™, The Future of Practice Management, found the percentage of practices using succession plans increased as practice owners’ ages increased. It revealed that, among practice owners between ages 60 and 64, 31 percent had succession plans. That number increased to 41 percent for owners of practices who were over age 65.

Succession Plan Requirements
The North American Securities Administrators Association (NASAA) is an association of state securities administrators who are charged with the responsibility of protecting consumers who purchase securities or investment advice. On April 13, 2015, the NASAA adopted the Model Rule on Business Continuity and Succession Planning.2
The rule states that every investment adviser shall establish, implement, and maintain written procedures relating to a business continuity and succession plan. It specifies two trigger events for such a plan: (1) death; and (2) disability of key personnel in a practice.
To protect investors, advisory practices need to “contain methods to minimize service interruptions and client harm,” according to the rule. However, language in most well-structured operating or buy-sell agreements include trigger events in addition to death and disability. The full scope of trigger events includes: (1) death; (2) disability; (3) voluntary or involuntary termination of employment; (4) retirement; (5) bankruptcy or insolvency; (6) divorce; and (7) revoked required professional license.
Goad (2003) suggested that a well-defined, well-written succession strategy for practices goes beyond just the trigger events, identifying additional areas that practices must consider in their overall succession strategy, including cultural fit, clients’ fit, team fit, and platform fit during and after the transition.
Both Pollock (1998) and Goad (2006) cautioned that FINRA Rule 2040 (which superseded NASD Rule IM-2420-2) needed to be addressed in the written succession plan prior to an actual transition. According to Goad (2006), NASD Rule IM-2420-2 “allows for a sharing of trails to be paid to the retiring rep or to their beneficiary in the case of death” (page 87).
Valuation Options
The 2013 FPA Research and Practice Institute™ study, The Future of Practice Management, found that 79 percent of practices measured their business performance based on assets under management.3 Pollock (1998) identified that AUM, gross revenue (gross dealer concession or GDC), and free cash flow (FCF) are all possible indicators upon which to value a practice.4
The majority of a practice’s revenue is often recurring revenue. The value of recurring revenue is much higher compared to that of commission revenue from one-time transactions. Recurring revenue sources can include AUM, life insurance policy commissions, and ongoing planning advice fees.
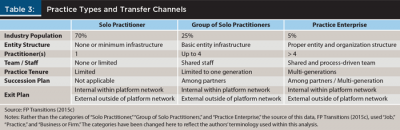
Advisory practices commonly fall into three general types: (1) solo practitioner; (2) a group of solo practitioners; and (3) practice enterprise. FP Transitions (2015c) found that 70 percent of practices are solo practitioners, 25 percent are groups of solo practitioners, and the remaining 5 percent are practice enterprises. Table 3 illustrates the breakdown of the three types of practices.
FP Transitions (2015c) suggested that many financial advisers assume succession planning is the same as exit planning, indicating that succession only exists for groups of solo practitioners or practice enterprises, but not among solo practitioners. Exit planning design is specifically for actual transactions of selling, mergers, or acquisitions.
Pollock (1998) and Goad (2005) identified two general valuation steps for practices. The first step is to determine the practice’s baseline value. The second is to apply industry-specific adjustments.
The baseline value can be determined by one of the three approaches: (1) income approach; (2) market approach; or (3) asset approach, according to Pollock (1998). FP Transitions (2015c) found that a practice’s baseline valuation approach largely depends on the type of practice.
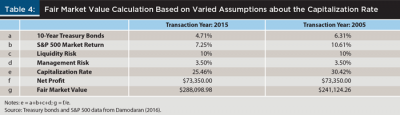
An income approach valuation method is based on market assumptions of capitalization, according to Pollock (1998) who summarized the makeup of capitalization rate assumptions, including those for: (1) risk-free rate (often 10-year U.S. Treasury bonds); (2) market/investment risk; (3) liquidity risk; and (4) management risk. An income approach uses the net profit from a practice divided by the capitalization rate, thus arriving at FMV.
Table 4 illustrates two valuations using the income approach based on 2015 and 2005 factors. Because the market return and long-term risk-free rate were both lower in 2015, there was a lower FMV of practices. Hence, the timing and the overall health of the economy plays a critical role if an owner of a practice desires a higher FMV.
A market approach often uses multiples in calculation. A multiple measures the buyer’s price (demand for the market price) divided by a financial measurement such as revenue, EBITDA, FCF, etc. A reputable specialist or generalist will use a number of industry multiples to determine the final valuation of a practice.
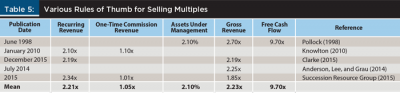
Table 5 consolidates different rules of thumb for selling multiples in the financial planning profession, as published by various sources. It demonstrates the highest mean value of selling multiples comes from using free cash flow. A majority of solo practitioners probably do not have FCF in their financial statements. That being said, recall that the 2013 FPA Research and Practice Institute™ study, The Future of Practice Management, found that 79 percent of practices measured their business performance based on assets under management. The value of the practices would then be determined by taking the mean multiples of 2.10 percent of their three-year average AUM. FP Transitions (2015c) found the market approach or using selling multiples from Table 5 is most suitable for solo practitioners or smaller practices.
The asset approach is more complex and often takes into consideration all tangible and intangible assets and liabilities, according to Pollock (1998) who suggested that the basis of an asset approach is the balance sheet adjusted to the realistic fair market value with the added element of goodwill, which he defined as comprising generic goodwill, ongoing concern, and other intangibles—each of which has value. In addition, FP Transitions (2015b) reminds sellers that tax treatment should be part of the overall exit design.
After the baseline value has been established, the second step of valuating a practice is to apply industry-specific adjustments. The adjustments can be somewhat subjective due to the fact that they are determined by the specialist’s or the generalist’s internal benchmarks. The quality of the historic benchmark held by the specialist or generalist depends on how many deals they’ve done. For example, consider a specialist who has experience with 1,000 deals, compared to a generalist, who has experience with 10 deals. The justification on selling multiples from the specialist represents a larger sample size. The qualities of the benchmark will also depend on with how much detail that specialist tracks the selling data points.
Goad (2005) offered an illustrated list of how the following adjustments impact the final selling price of a practice: the quality of the clients; the quality of the team; and the quality of the platform.
The quality of the clients is determined by a client retention ratio, type of client assets in AUM, profit per client ratio, profit per employee ratio, age of the clients, and age of the client assets. FP Transitions (2015a) translated the quality of the clients into what they called “cash flow quality” in their valuation approach.
The quality of the team mostly centers on the skills of its employees. For example, the practice may have a specialty offering in designing more than $50 million net worth in estate planning documents and services. One or two employees might hold specialty licenses in such an area.
The quality of the platform can include the technology of the underlying platform and manufacturer(s) with which the practice is affiliated. Succession Resource Group (2015) identified a particular platform that has higher multiples when selling within that platform’s umbrella. In addition, the intellectual property of a practice’s own processes in financial planning (service offering), client retention, client referral, lead generation, and/or specialty referral network (such as tax, legal, special needs, etc.) offers important valuation aspects for potential buyers to consider.
These kinds of adjustments translate into value drivers for the practice. For example, Anderson, Lee, and Grau (2014) suggested the following are value drivers: sales or gross revenue; location or geographic area; client retention risk; key person dependency; technology platform; type of deals or financing; and market demand. Succession Resource Group (2015) suggested these are value drivers: robust franchised network to sell within the network; CRM technology platform and ease of merging customers; and client retention.
Methodology
This study used a secondary dataset from Pratt’s Stats, an online database of financial details on nearly 26,000 acquired private companies. Pratt’s Stats is a subscription-based service provided by the company Business Valuation Resources to professional valuation firms and financial intermediaries. Buying and selling transactions in the database have 140 data points. This database is commonly used by specialists and generalists to evaluate FMV of financial planning practices, or many other types of businesses. Business Brokers of Florida (bbfmls.com), International Business Brokers Association (ibba.org), and other U.S. business brokers contribute to the Pratt’s Stats transactions data.
The strength of using Pratt’s Stats as the dataset is that it collects data on a continuous basis with data points such as FMV, age of the practice, buyer down payment amount, seller financing amount, non-compete agreements, etc. The weakness of it as a dataset is that it does not collect information on the kinds of adjustments that may translate into value drivers for the practice, such as those mentioned earlier. The limitation of Pratt’s Stats is that there was, specifically, no industry-specific adjustment data for: (1) the quality of the practice’s clients (or type of revenue); (2) the quality of the team; and (3) the quality of the platform.
This study included data from Pratt’s Stats in the following North American Industry Classification System (NAICS) codes from 2001 to 2016:
- 523120 Securities Brokerage
- 523920 Portfolio Management
- 523930 Investment Advice
- 523999 Miscellaneous Financial Investment Activities
- 524210 Insurance Agencies and Brokerages
This study filtered out U.S. firms with revenue less than $10 million. Selling transactions were with private buyers or non-publicly trading buyers, and the transaction currency was the U.S. dollar. The dataset for this study had 132 transactions as of June 10, 2016.
For this study, financial statement items were reviewed in relation of the market value of invested capital or final selling price of a practice (MVICPrice). Financial statement items of practices were net sales (revenue), gross profit (GP), earnings before interest and taxes (EBIT), and earnings before interest, taxes, depreciation, and amortization (EBITDA).
Two variables were derived from the financial statement items in the dataset commonly used in buying and selling transactions: discretionary earnings (DE); and book value of invested capital (BVIC). DE was calculated by adding the owner’s compensation, depreciation, and amortization to EBIT. BVIC was calculated by subtracting total liabilities from financial statement items of total assets, then adding long-term liabilities (also known as capital).
This study then categorized the sample selection by the following annual revenue sizes:
Solo practitioner 1, or Size1: revenue less than $250,000.
Solo practitioner 2, or Size2: revenue between $250,001 and $500,000.
Group of solo practitioners 1, or Size3: revenue between $500,001 and $1 million.
Group of solo practitioners 2, or Size4: revenue between $1.001 million and $5 million.
Enterprise practice, or Size5: revenue more than $5 million.
When evaluating the initial multiple linear regression model, the dependent variable was MVICPrice, and the explanatory variables were revenue, BVIC, DE, EBIT, and EBITDA.
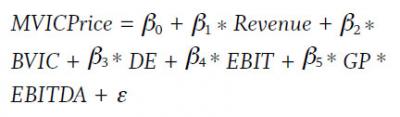
This model resulted in an R-square of 0.9284. The explanatory variables were too closely related and caused collinearity. For example, EBIT derives from revenue. EBIT equals to revenue subtracting cost of goods sold, selling and administration expenses, depreciation, and amortization. GP, or gross profit, equals revenue minus the cost of goods sold. EBITDA equals EBIT plus depreciation and amortization. Hence EBIT, GP, and EBITDA are all highly correlated with revenue.
To reduce collinearity, the above model needed to be transformed by dividing revenue in both dependent and explanatory variables. Model 1 then was transformed to express each resulting ratio into:
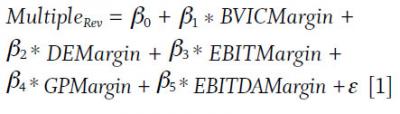
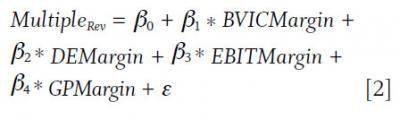
However, EBITMargin and EBITDAMargin in model 1 were still highly correlated. Model 2, therefore, removed the worst predictor, EBITDAMargin:
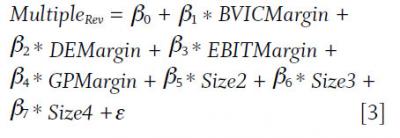
To further evaluate the relationship between selling revenue multiple and the size of the practice, model 3 added five dummy variables using the size categories described previously. For example, Size1 was 1, indicating that revenue size was less than $250,000, otherwise Size1 was 0 and so on. There was one observation for revenue size that was more than $5 million, therefore, the last two revenue size categories listed previously were combined into Size4 (Size4 was 1, indicating that revenue size was more than $1.001 million, otherwise Size4 was 0).
Model 3 deployed Size2, Size3, and Size4 to show the size of the revenue in relation to the selling revenue multiple. Size1 was excluded from model 3 to avoid perfect collinearity.
To further illustrate the size of revenue in relation to the selling revenue multiple, model 4 expressed the interaction among explanatory variables. Model 4 multiplied each size by each margin.
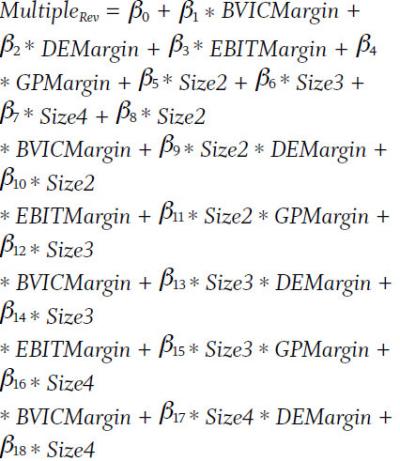
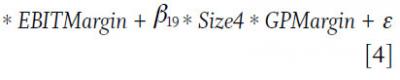
Model 1 through model 4 intended to answer the research question: what is the relationship between the selling revenue multiple in a financial planning practice and the revenue size of the practice? The null and alternative hypotheses for this test using model 3 were:
A null hypothesis was that the revenue size of the practice had no effect on the revenue multiple.
Data Analysis and Procedures
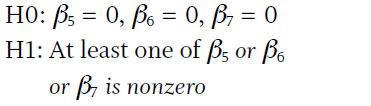
Table 6 illustrates the descriptive statistics of all variables. The mean revenue multiple from Table 6 is 1.47x, compared to Table 5, which indicated a mean of 2.23x. Recall that specialists have an internal benchmark that may have resulted in Table 5 differences. However, the revenue multiple in Table 7 is 34.09 percent smaller if the generalists used benchmark data from Pratt’s Stats. Generalists commonly rely on Pratt’s Stats to perform appraisals, regardless of the niche. If an owner of a practice is looking to expand by acquiring, it may be best to use a generalist to achieve cost-effective expansion. However, if an owner is seeking higher FMV when exiting the practice, it may be best to use a specialist.
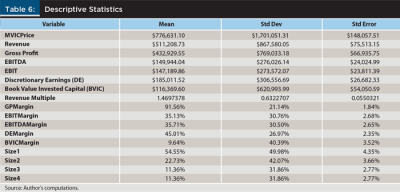
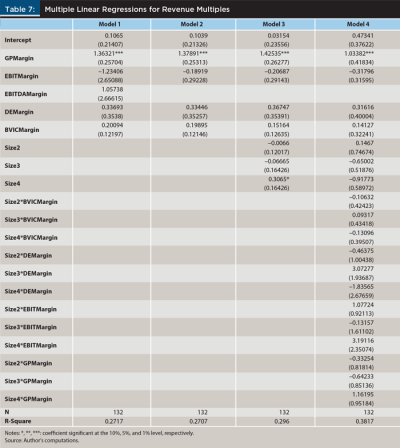
Table 6 shows the mean of GPMargin or gross profit margin is 91.56 percent. GPMargin in the financial planning profession has a lot to do with the practice’s affiliated platform. For example, revenue minus cost of goods sold is gross profit. Cost of goods sold in a practice is essentially the fee the platform charged to operate under their umbrella. Therefore, cost of goods sold can loosely equate to fees from a platform.
EBITMargin or EBIT (or operating income) margin is 35.13 percent. EBITMargin represents the efficiency of the practice’s management performance. DEMargin, or discretionary earnings margin, is 45.01 percent. DE takes EBIT then adds back the practice owners’ compensation and non-cash items depreciation and amortization. Discretionary earnings show the buyer(s) a reasonable expectation for annual earnings potential. BVICMargin, or book value of invested capital margin, is 9.64 percent. BVIC shows buyers how much the practice can generate in revenue from the capital.
Table 7 reports results of multiple linear regressions using the revenue multiple as the dependent variable. Model 2 has the lowest R-square of 0.2707, and model 4 has the highest R-square of 0.3817. Model 4 can explain the revenue multiple better when compared to the other three models.
The analysis reveals that gross profit margin (GPMargin) is the most statistically significant and can best predict the revenue multiple among the four models identified. Recall that GPMargin is related to the platform a practice is affiliated with. This finding reinforces that platform matters, as similarly found by Succession Resource Group (2015).
Additionally, Size4 in model 3 is statistically significant. FP Transitions (2015c) found that smaller practices tend to use a market approach or other selling multiples such as type of revenue or AUM. However, this study found that Size4 was a good predictor of the selling revenue multiple, not smaller practices. This means that Size4 (a practice with more than $1 million in revenue) can better predict the selling revenue multiple. For Size2 or Size3 (practices with revenue of $500,000 or less), it is better to use other types of revenue multiples, such as selling a multiple of AUM, or a multiple of recurring revenue. Future studies are needed to analyze which selling multiple would be appropriate when predicting the most accurate sales price for smaller practices.
The null hypothesis using model 3 was that the size of the practice has no effect when predicting the selling revenue multiple.
The null hypothesis was tested using a = 0.05, and the critical value from the F-distribution. The F-test statistic was 1.42 greater than the F-distribution of 1.17. This test rejected the null hypothesis; the size of the practice does have a statistically significant effect upon the selling revenue multiple. The result was the same when repeating this testing process using model 4.
Examples
Table 8 uses model 3 to illustrate examples of three practices. Practice A has less than $500,000 revenue or GDC, 70 percent gross profit margin (GPMargin), 11 percent earnings before interest and taxes margin (EBITMargin), 27 percent discretionary earnings margin (DEMargin), and 5 percent book value of invested capital margin (BVICMargin). Recall that the dataset used in this analysis is primarily used by generalists. When you plug in the explanatory variables for Practice A into model 3, the revenue multiple is 1.11. However, because a generalist’s multiple is 34.09 percent less than a specialist’s, as explained earlier, the estimated specialist’s revenue multiple would be 1.68.
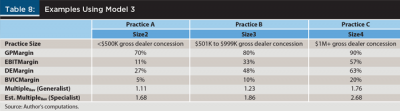
Practice B has GDC between $500,000 and $999,999, 80 percent GPMargin, 33 percent EBITMargin, 48 percent DEMargin, and 10 percent BVICMargin. The generalist’s revenue multiple is 1.23, and the specialist’s revenue multiple would be 1.86.
Practice C has more than $1 million GDC, with 90 percent GPMargin, 57 percent EBITMargin, 63 percent DEMargin, and 20 percent BVICMargin. The generalist’s revenue multiple is 1.76, and the specialist’s revenue multiple would be 2.68.
Table 8 does not predict that size produces the largest selling revenue multiple; additional research is needed in this area.
Implications
Various value drivers (mentioned earlier) used by specialists will push adjustments upward to favor the seller, if certain business model aspects are in place. These adjustments may include the quality of the clients, the team, and the platform. Comparing the mean selling revenue multiple shown in Table 6 (1.47) with previously published selling multiples from various sources shown in Table 5, suggests that when buying a practice, using a generalist is the most cost efficient; but when selling a practice, using a specialist is more favorable for the seller.
This discrepancy between specialists and generalists could potentially impact a practice owner’s retirement funding. For example, 1.47 in Table 6 is the mean selling revenue multiple from generalists. But the mean selling revenue multiple from specialists would be 2.23. If a practice owner considers the selling revenue multiple like a severance package from a job, the generalists’ selling price would generate, for example, an average of 17.4 months of severance, compared to the specialists’ price that could generate 26.76 months of severance. Of course, solely relying on selling the practice may not fully fund the practice owner’s retirement.
How can a practice owner differentiate a specialist from a generalist other than the number of deals completed and their experience in the financial planning profession? Many platforms have a list of qualified specialists to work with, and it may be wise to seek help within the platform first. RIAs may wish to seek advice from their professional network, such as the Financial Planning Association or similar organizations for recommendations on a qualified specialist.
Practice owners could use Table 7 to predict the selling revenue multiple to a certain degree. Without the value driver adjustments explained earlier, such as the quality of the clients, the team, and the platform, it is not a complete revenue multiple prediction. However, Table 7 can provide direction for which financial statement items practice owners may wish to focus on, such as gross profit, EBIT, etc., in their business model to best predict the selling revenue multiple. Practice owners have control of their financial statement items; they can reduce costs as well as increase the operating income or EBIT.
This study found that the size of the practice had an effect on its selling revenue multiple. However, due to limitations in the dataset, the predictability of a larger practice size resulting in a larger revenue size was not analyzed in this study. Future study is needed to analyze whether there is an incentive for a practice owner to increase the revenue size for a larger selling revenue multiple.
In addition to the financial ratio variables identified in Table 7 and the possible practice value drivers explored earlier, practice owners must consider other factors when exiting their practice.
Slee (2009) indicated three timing factors that must align when planning a successful business exit: (1) personal timing, or the readiness of the owner to move on to something else more or less challenging; (2) business timing, or having a solid key management team able to operate with or without the owner or founder; and (3) economic timing, or knowing where the economic cycle is and if the industry is trending in the buying and selling movement (both in transaction volume and owner demographics).
This study found that gross profit margin is statistically significant when predicting the selling revenue multiple. Practice owners may wish to consider comparing platforms to yield a better selling revenue multiple, but further study is needed, including a closer look at the effects that the quality of the clients and the quality of the team have on a practice’s value.
Conclusion
This study explored the research question: what is the relationship between a financial planning practice’s selling revenue multiple and its revenue size? This study found that the size of the practice had an effect on its selling revenue multiple. Additionally, gross profit margin resulted in the best predictor of the selling revenue multiple.
This research also found that a specialist provided a more favorable revenue multiple when selling a practice than a generalist. But using a generalist was more favorable for buying a practice. A practice owner would do best to check the qualified specialists listed within his or her existing platform or professional network. Additionally, the revenue multiple alone may not satisfy the practice owner’s retirement needs. Just like most business owners, it appears to be best for financial planning practice owners to have sufficient retirement resources and not rely on selling his or her practice to sustain a successful retirement.
Several future research studies and resources should be considered. First, there is a need for an open source, industry benchmark database similar to Pratt’s Stats. Such a benchmark could include industry-specific data points in the areas of quality of the clients, quality of the team, and quality of the platform.
Second, there is a need to provide statistically significant analyses for industry-specific adjustments in relation to the final sales price of financial planning practices. Third, there is a need to analyze the timing of sales transactions and their correlation to fair market value within the broader economic cycle. Fourth, future research could examine if the platform really matters in the final sales price, and if it’s better for a practice to sell inside the platform or outside that platform.
Finally, there should be a policy proposal for extending the two existing trigger events (death and disability) of the NASAA succession planning rule into seven triggers: (1) death; (2) disability; (3) voluntary or involuntary termination of employment; (4) retirement; (5) bankruptcy or insolvency; (6) divorce; and (7) revoked required professional license.
Endnotes
- See The Cerulli Edge—Advisor Edition, Q2 2003, issue No. 39 available at common.money-media.com/php/image.php?id=142311&ext=.pdf.
- The full text of the rule is available at nasaa.org/wp-content/uploads/2011/07/NASAA-Model-Rule-on-Business-Continuity-and-Succession-Planning-with-gu....pdf.
- Access the full study at OneFPA.org/business-success/ResearchandPracticeInstitute/Documents/RPI%20Future%20of%20Practice%20Management%20Report%20-%20Dec%202013.pdf.
- The formula for FCF is: cash flow from operating activities + interest expense x (1 − effective tax rate) − capital expenditure.
References
Anderson, John D., Raef Lee, and David Grau Sr. 2014. “Acquisition and Succession: Shift Your Focus from Retirement to Growth.” SEI Advisor Network and FP Transitions white paper available at seic.com/enUS/advisors/14065.htm.
Browning, Christopher and Michael S. Finke. 2016. “Conducting Research in Financial Planning.” In Xiao, J. J. (Eds.), Handbook of Consumer Finance Research. Switzerland: Springer International Publishing.
Clarke, Paul. 2015. “Allstate Agency Value Index.” Report available at http://www.ppcloan.com/AllstateValueIndex/FrameHost.aspx.
Damodaran, Aswath. 2016. “Annual Returns on Stock, T. Bonds and T. Bills: 1928–Current.” Online spreadsheet available at pages.stern.nyu.edu/~adamodar/New_Home_Page/datafile/histretSP.html.
FP Transitions. 2015a. “Understanding the Value of Your Practice.” Report available at fptransitions.com/understanding-the-value-of-your-practice.
FP Transitions. 2015b. “Taxation of an Asset Sale in a Financial Services Practice.” Report available at fptransitions.com/tax-treatment-asset-sale.
FP Transitions. 2015c. “Structuring the Deal.” Report available at fptransitions.com/structuring-the-deal.
Goad, David. 2003. “Profiting Today by Planning for Tomorrow’s Succession.” Journal of Financial Planning 16 (9): 44–52.
Goad, David. 2005. “What Are You Worth?” Financial Planning 35 (8): 74–75.
Goad, David. 2006. “The Upside of Offering Exit Planning to Your Reps.” Journal of Financial Planning 19 (4): 86–89.
Knowlton, John. 2010. “Building a Successful Succession Plan for a Financial Service Practice.” Journal of Financial Service Professionals 64 (1): 60–65.
Pollock, Stanley L. 1998. “Business Transition: How to Value Your Financial Planning Practice.” Journal of Financial Planning 11 (3): 64–71.
Potts, Tom L., John E. Schoen, Margery Engel Loeb, and Fred S. Hulme. 2001a. “Effective Retirement for Family Business Owner-Managers: Perspectives of Financial Planners, Part I.” Journal of Financial Planning 14 (6): 102–112.
Potts, Tom L., John E. Schoen, Margery Engel Loeb, and Fred S. Hulme. 2001b. “Effective Retirement for Family Business Owner-Managers: Perspectives of Financial Planners, Part II.” Journal of Financial Planning 14 (7): 86–96.
Slee, Rob. 2009. Midas Marketing: How Midas Managers Make Markets. Charlotte, N.C.: Burn the Boats Press.
Succession Resource Group. 2015. “The Value of Supported Independence.” Report available at successionrg.wpengine.com/wp-content/uploads/2015/06/The-Value-of-Supported-Independence-2015.pdf.
Citation
Chien, Chia-Li. 2017. “Selling a Planning Practice: The Relationship between Revenue Multiple and Revenue Size.” Journal of Financial Planning 30 (3): 52–61.