Journal of Financial Planning: March 2016
David Nanigian, Ph.D., is an associate professor of investments in the Richard D. Irwin Graduate School at The American College and will join the Mihaylo College of Business at Cal State Fullerton in August. He is internationally known for his research on mutual funds. Learn more about his research at ssrn.com/author=843211.
My November 2014 Journal column (“New Perspectives on the Active versus Passive Debate”) explored how prior research has documented a negative relationship between expenses and performance in the market for mutual funds, and how this has spurred the trend toward low-cost index fund investing. In this month’s column, I point out an econometric problem with the majority of the empirical studies that have documented a negative expense-performance relationship and what this means for financial planners when selecting mutual funds for clients.
An Underappreciated Finding from 2005
In the 2005 paper, “Out of Sight, Out of Mind: The Effect of Expenses on Mutual Fund Flows,” by Brad M. Barber, Terrance Odean, and Lu Zheng published in the Journal of Business, the authors assigned each mutual fund to one of 10 groups based on its decile rank of expense ratio and examined the performance of each group of funds over the subsequent year. Within each of the nine groups that consisted of funds that ranked in the bottom 90 percent of expense ratio, the authors found that the average annualized CAPM alpha ranged from –1.79 percent for funds that ranked in the sixth decile, to –0.35 percent for funds that ranked in the ninth decile, yet none of the alphas were statistically distinguishable from zero at the 10 percent level.
Therefore, as the authors stated in their paper, “there is no discernible relationship between performance and expenses for the majority of funds.” However, the funds that ranked in the top decile of expense ratio performed much worse than their peers. The average annualized CAPM alpha for these funds that ranked in the top 10 percent of expense ratio was –4.39 percent and statistically significant at the 5 percent level.
If the negative relationship between mutual fund expenses and performance was linear, as most of the empirical literature assumes, then financial planners should correctly believe that the cheapest funds perform the best, and therefore, they are the ones that would be most prudent to select for their clients.
However, as Barber, Odean, and Zheng’s analysis shows, the relationship is not linear. Therefore, what can be said about the role of expense ratios in the mutual fund selection process isn’t that financial planners should seek funds with the lowest expense ratios, rather that they should avoid funds with the highest expense ratios.
The Expense-Performance Relationship from 2000 to 2015
Barber, Odean, and Zheng conducted their analysis of the expense-performance relationship over the time period 1970 to 1999. The financial dynamics of the mutual fund industry have changed since then (see the Investment Company Institute’s 2015 Investment Company Fact Book for a discussion of this). Therefore, the remainder of this column will examine the expense-performance relationship over the time period from 2000 to 2015.
To conduct this analysis, I gathered the net-of-expense returns on all actively managed U.S. equity mutual funds from Morningstar Direct and, on January 1 of each year, sorted each fund into one of 10 groups based on its decile rank of annual report net expense ratio in the prior year.1 Then, for each group, I constructed a portfolio that equally allocated capital across each fund in the group. The portfolios were rebalanced monthly and, in the event that a fund disappeared from the dataset, the capital invested in it was equally allocated among the remaining funds in the portfolio. I measured the CAPM alpha of these portfolios using the return on the Wilshire 5000 Total Market Index to proxy for the return on the market, and the average auction yield on one-month Treasury Bills to proxy for the risk-free rate.
The annualized CAPM alphas on these portfolios are displayed in Table 1. The alphas generated by the nine portfolios that consisted of funds that ranked in the bottom 90 percent of expense ratio ranged from –0.13 percent for the decile 9 portfolio, to 0.87 percent for mid-priced decile 5 portfolio. This confirms Barber, Odean, and Zheng’s finding that an expense-performance relationship does not exist for the majority of funds.
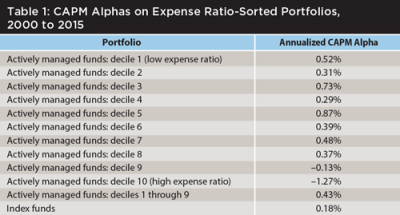
However, the alpha generated by the decile 10 portfolio was –1.27 percent. The magnitude of this underperformance is 10 times greater than that which was generated by the second-worst performing portfolio. It is also interesting to note that while two of the portfolios generated negative alphas, none produced alphas that were statistically significantly different from zero. This provides evidence in opposition to the common belief that actively managed funds underperform the market on a risk-adjusted basis.
Table 1 also displays the perfor mance of two additional portfolios, a “1 through 9” portfolio that invests in any actively managed U.S. equity mutual fund that does not rank in the top decile of expense ratio, and an “index funds” portfolio that invests in U.S. equity mutual funds classified by Morningstar as index funds (these were virtually non-existent during much of Barber, Odean, and Zheng’s study period).
The alpha generated by the 1 through 9 portfolio was a respectable 0.43 percent. This is more than twice as large as the 0.18 percent alpha generated by the index funds portfolio, indicating that 2000 to 2015 was a good time to be an investor in reasonably priced, actively managed funds. Although the index funds portfolio generated more alpha than the decile 9 and decile 10 portfolios, it generated less alpha than each of the eight portfolios that consisted of funds that ranked in the bottom 80 percent of expense ratio.
Table 2 illustrates how nonlinearity in the expense-performance relationship biases inferences from the mutual fund performance regressions that are commonly employed in the empirical mutual funds research. In each year from 2000 to 2015 I regressed annualized CAPM alpha on the prior year’s annual report net expense ratio. I did this for two samples of funds. The first sample consists of any actively managed U.S. equity mutual fund that had a continuous time-series of 12 monthly returns over the year. The second is a subsample of funds in the first sample that did not rank in the top decile of annual report net expense ratio in the prior year.
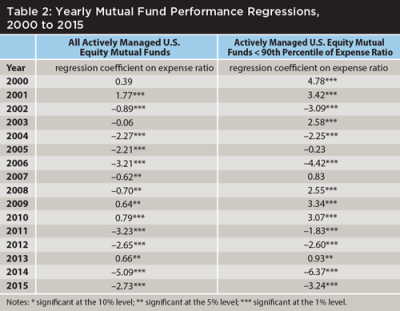
The results from performance regressions involving the full sample are not surprising. In 11 of the 16 years, the regression coefficients on the expense ratio variable were negative, in 10 of the years they were negative and statistically significant at the 5 percent level, and in eight of the years they were negative and statistically significant at the 1 percent level. Over the 16 years, the average regression coefficient on the expense ratio variable was –1.21, indicating that investors lose a little over a dollar in net return per each additional dollar they pay in operating expense. This is consistent with the findings from most of the modern empirical studies on the expense-performance relationship.
The results from the performance regressions involving the subsample of funds that ranked below the 90th percentile of expense ratio were vastly different from the full sample. In eight of the 16 years, the regression coefficients on the expense ratio variable were negative, and in the other eight they were positive. In seven of the years they were negative and statistically significant at the 1 percent level. Similarly, in seven of the years they were positive and statistically significant at the 5 percent level, and in six of the years they were positive and statistically significant at the 1 percent level.
Most strikingly, the average value of the regression coefficient on the expense ratio variable over the 16 years was an economically meaningless –0.16. While slightly negative, it is only one eighth the magnitude of that which was observed in the full sample.
What all of this means is that because most of the modern empirical studies on the expense-performance relationship don’t control for its nonlinear nature, financial planners mistakenly believe that they should search for funds with the lowest expense ratios. Instead, they should avoid funds with the highest expense ratios. They should also incorporate a variety of other characteristics that meaningfully impact risk-adjusted performance into their mutual fund selection process.
If you haven’t had the opportunity yet, I encourage you to learn about these characteristics in the November 2015 Journal column “Updated Advice on Mutual Fund Selection.”
Endnote
- Expense ratios and net-of-expense monthly returns on share classes are aggregated to the fund portfolio level by weighting them by the prior month’s total net assets.