Journal of Financial Planning: June 2012
Recent market highs have not begun to erase earlier market lows from investor consciousness. On October 8, 2007, the Dow Jones Industrial Average hit a high of 14,903 (S&P 500 = 1,561) only to tumble relentlessly to a low of 6,547 (S&P = 676) March 9, 2009, for a gut-wrenching decline of –54 percent (S&P = –57 percent) in less than 18 months. With no place to hide at the time, traditional market lore offered satirical consolation—the only thing that goes up in a down market is correlations.
Testing this lore, the FPA 2012 Trends in Investing study asked advisers whether their correlation assumptions/figures for asset classes used in asset allocation changed since 2008. A hefty 43 percent of planners see correlations trending upward and have increased their correlation assumptions accordingly. However, the large percentage of planners concerned about rising correlations is offset by an almost equal number of planners (41 percent) who have not changed their assumptions.
This split reflects the broader theoretical war, ignited by the 2008 bear market, over modern portfolio theory (MPT) and its siblings: the efficient market hypothesis, the capital asset pricing model (CAPM), and asset allocation. Before the markets had time to recover, academic Armageddon was announced by George Soros: “The prevailing interpretation of financial markets—the efficient market hypothesis—has been well and truly discredited by the crash of 2008.”1
Raymond James Financial adviser Carl Mahler stood before a group of fellow advisers and confessed: “Hi. My name is Carl, and I’m a recovering asset-allocationist.”2
However, no report of gloom had quite the prophetic impact of former Federal Reserve chairman and ultra free-marketer Alan Greenspan, who admitted to a congressional committee on October 23, 2008, that “the whole intellectual edifice … collapsed in the summer of last year.”
Hold the Funeral
The Achilles’ heel of MPT—its dependence on combining uncorrelated assets—was exposed in 2008. However, the much-touted death of MPT found few mourners among the advisers and industry experts interviewed by the Journal of Financial Planning. Although all concurred equity asset classes went toward one (+1.0) during the credit crisis, none abandoned the theory that quantifies diversification through the correlation coefficient—a number between +1.0 (perfect positive correlation) showing assets moving in tandem and –1.0 (perfect negative correlation) showing assets moving in opposite directions.
Perfect positive correlation may be a great benefit in, say, a married couple’s attitudes toward money. But in MPT, a perfect positive is a big negative (and vice versa). The beauty of MPT is that correlations need not be negative. Anything less than perfect positive correlation can reduce portfolio risk. Strong correlation is often considered anything over 0.75, moderate correlation anything between 0.25 and 0.75, and weak correlation anything between –0.25 and 0.25; the weaker the better. However, there are no hard and fast rules. Johan Grahs, CFA, portfolio adviser for Kinsight LLC in Birmingham, Alabama, considers anything above 0.90 as high correlation and anything in the neighborhood of 0.40 as low correlation. Famed finance professor Burton Malkiel uses slightly different criteria in his book A Random Walk Down Wall Street. His guides are: +1.0, no risk reduction is possible; +0.5, moderate risk reduction is possible; 0, considerable risk reduction is possible; –0.5, most risk can be eliminated; and –1.0, all risk can be eliminated.3
“The credit crisis was a good stress test for modern portfolio theory,” asserts Larry Luxenberg, CFA, a partner with Lexington Avenue Capital Management in New City, New York, strengthening his belief in broad global diversification. Luxenberg started his career as a securities analyst in 1983, doing quantitative and fundamental analysis. There are always tighter correlations in both bull and bear markets, he notes. Going to one is no excuse for going to cash, nor is diversification nullified by high correlations. For one reason, as emotions take charge investors tend to be less selective, selling everything in sight toward the end of bear markets and desperate to invest cash at the beginning of bull markets. For another, climactic sell-offs create liquidity crises that feed on themselves. Although both of these phenomena may trigger higher correlations, they result from factors having nothing to do with correlation itself. And, given the propensity to “loss aversion,” investors often fixate on bear markets like 2008, forgetting the dramatic S&P spike in mid-2009.
Thomas Balcom, CFP®, CAIA, founder of 1650 Wealth Management in Boca Raton, Florida, concurs with Luxenberg’s behavioral observation: “My job is to manage the greed and fear of my clients, to listen to them and make them comfortable. I spend more energy dealing with my clients’ emotional volatility than with their investment volatility.” Balcom advises clients not to let CNBC’s five-minute time horizon cloud their judgment.
Multifaceted Diversification
Behavioral finance aside, Roger Gibson, CFA, chief investment officer for Gibson Capital in Wexford, Pennsylvania, and author of Asset Allocation: Balancing Financial Risk, argues that the 2008 market decline may have invalidated some adviser/investor ideas about what strategic asset allocation offers, but it did not invalidate the diversification value of a strategic asset allocation approach. Gibson advocates diversification across four equity classes for client portfolios: U.S. stocks, non-U.S. stocks, real estate securities, and commodity-linked securities. He defines a “failure of diversification” as any year when all four of these asset classes simultaneously have either below-average or above-average returns. Given this definition, Gibson argues that between 1972 (the earliest point for which we have index data for all four equity asset classes) and 2008, there were six years when diversification failed.
He adds, “In three of these years, all four equity asset classes simultaneously had below-average returns, and in the other three all simultaneously had above-average returns. Such ‘failures of diversification’ are therefore not particularly unusual.… During a panic, investors dump risky assets and equity asset class correlations soar.”
Gibson emphasizes that if simultaneous below-average performance is a failure of diversification, simultaneous above-average performance is also a failure. The only difference is that no one complains about the latter kind of failure. The recipe for disaster years, he claims, is a meaningful allocation to interest-generating investments, even for clients with long time horizons and high risk tolerance.
Strategic asset allocation should include allocations to short-term debt, U.S. bonds, and non-U.S. bonds, Gibson elucidates in Asset Allocation.4 The 2008 financial crisis actually demonstrated the value of strategic asset allocation with high-quality bonds performing particularly well. “During 2008, there were investments zigging while others zagged,” he says. “You just had to have meaningful diversification across interest-generating investments to receive the payoff.”
Managing partner and director of family strategy for the Greenway Family Office in St. Louis, Missouri, Joan Malloy, CFA, CPA, CFP®, agrees, but from a different perspective. She notes that cash, Treasuries, and gold all escaped the 2008 debacle. Because her firm serves nine core client families that depend on investment income, she must be particularly sensitive to her clients’ need for secure income as well as their need for asset protection (an average net worth of $40 million per client family).
Malloy explains, “What we learned from 2008 was to diversify the ‘source’ of our returns. Our clients need to have income derived from real estate rents, master limited partnerships, bond coupon payments, dividends, etc. As advisers we need to drill down and analyze the risks that could pose a threat to the return source; diversification in terms of industries and not just asset classes. In addition the crash should reinforce the need to keep a cushion of liquid assets.”
However, 2008 is not the only source of concern. Two studies by J. P. Morgan’s Global Equity & Delta One Strategy department analyze “Why We Have a Correlation Bubble” (October 5, 2010) and “Rise of Cross-Asset Correlations” (May 16, 2011). The first study shows correlations between stocks at their highest level in recent history: “While the levels of correlation ebb and flow with business and volatility cycles, the average level of correlation was gradually increasing over the past 10 years, even prior to the 2008 credit crunch.”
The second study shows broad cross-asset-class correlation doubling over the past 10 years. “Over the past decade, investors witnessed a significant increase of correlation between equities as well as an increase between other risky assets such as credit, foreign exchange, interest rates, and commodities.”
Looking forward from 2008, Malloy observes that bonds outperformed equities four to one in 2011, signifying a correlation far below +1.0. She argues that traditional asset allocation was vindicated only three years after the devastation of the market. Several major indices performed quite differently from each other in 2011, all based on dissimilar reactions to the same events in Europe:
- The S&P 500 Index had a slight positive total return of 2.1 percent
- The Vanguard REIT Index Fund returned a positive 8.6 percent
- The Alerian MLP Index (energy MLPs) posted a total return of 13.88 percent
- The international MSCI EAFE Index was down –12.1 percent
- The Barclays Capital 7-Year Municipal Bond Index was up 10.1 percent
Malloy quips, “If that’s not diversification, what is?” She adds that divergence also could be seen within various equity subsectors, for example, large-cap equities versus small-cap equities. (To be precise, she notes, diversification should refer primarily to asset classes and only secondarily to different types of equities, for example, large, small, or international.)
Allocation Assumptions and Strategies
Whether the trend of closer correlation is relatively long- or short-lived, how are advisers coping with higher correlations today? Various strategies include a renewed emphasis on alternative investments, global diversification, fundamental equity analysis, and a shortening of capital market assumptions.
Balcom, a Chartered Alternative Investment Analyst, believes that certain alternative investments (or alts for short) offer a real alternative to highly correlated asset classes. Real means these alts do not fall prey to the simple Malkiel popularity paradox wherein the popularity of any investment strategy automatically destroys the benefits of that strategy.5
“Correlations inevitably move to one as everyone uses the same strategies,” says Balcom. “For this reason higher correlations are not going away because all advisers are diversifying.”
Alternative investments have been defined as investments that are not cash, stocks, or bonds. What Balcom terms first-level alternative investments—for example, REITs, commodities, funds of funds—evolved to meet the growing demand for diversification outside cash, stocks, and bonds.
According to FPA’s 2011 Alternative Investments study, reported in the September 2011 Journal, the top criterion for investing in alts was correlation. Not surprisingly the favorite alts in the survey—REITs and commodities—have lost diversification value as they gained popularity. As the first level of alts began “going to one,” advisers and their clients were driven to use alts that still had low correlation.
Balcom mitigates risk in client portfolios by incorporating hedging strategies—second-level alts—such as long-short funds, market-neutral funds, structured notes, and managed futures. His clients are more than willing to trade some potential upside for more downside protection. Since 2008 he has been noticing that younger and older generations alike want to get off the market roller coaster. Approximately one-third of his client portfolios are in alternative investments (both first and second level).
A major difference between first- and second-level alts is the innate subjectivity of hedging strategies, making them less likely to fall prey to the Malkiel popularity paradox. According to Balcom, everyone is not going to short the same stocks in the same sectors at the same time, thus protecting these alts to some degree from destructive herd behavior.
Nor has the crash of 2008 changed Luxenberg’s commitment to diversification. He asserts, “If anything I adhere more to passive management and broad global diversification.” As a securities analyst in the early part of his career, he spent 15 years studying and trying to predict correlations. “I’m satisfied that I cannot do it,” says Luxenberg. “Nor have I seen evidence that anyone can do it.”
The inability to predict correlations or extreme fluctuations such as the 1,000-point intraday Flash Crash of May 6, 2010, does not nullify the efficient market hypothesis. According to Luxenberg, “Efficiency simply means you cannot capitalize on price movements.”
Diversification is the only sensible response, and Luxenberg likes to own stocks around the world. He believes owning everything is a powerful tool over time. For example, he remembers foreign emerging markets represented only 4 percent of world stock market capitalization in 2003. Although this class “got killed” in 2008, it now represents 13 percent of world equity capitalization—reason enough to stay well diversified, he says.
Global diversification escapes Malkiel’s popularity paradox for two reasons. Explains Luxenberg: “I don’t think global diversification will ever reach a saturation point; first because saturation would assume patience on the part of all investors, and second because all investors would need to give up on the idea that each one is the smartest person in the world.” Neither scenario is likely, he thinks.
During the “nowhere decade” of the 2000s, Malloy’s family office clients maintained an annual 4 percent return on their portfolios with broad diversification, including high-quality bonds in 2008. Her firm adheres to a passive core and active satellite combination, focusing on fundamentals more than on correlation. As she explains, “You don’t go international just for correlation purposes but for return opportunities on emerging markets and natural resources. In the long term, fundamentals matter and drive performance. Stronger companies will generate better returns over time, even if the S&P stocks are moving together.”
Recently Malloy’s firm started using the Research Affiliates Fundamental Index® (RAFI) strategy in its core portion (representing 50 percent–70 percent) of client portfolios. Founded in 2002 by Rob Arnott, RAFI favors the economy-centric approach of legendary investors Benjamin Graham and David Dodd. RAFI selects and weights stocks by non-price measures of firm size using four variables: sales, cash flow, dividends, and book value. This composite-fundamentals approach avoids the structural bias of any one variable.
In the most recent revision of his firm’s capital market assumptions, Gibson has shortened the data period from 38 years to 18 years. Although choosing a very long period of data has the advantage of incorporating a variety of market environments, choosing a shorter period will better reflect possible long-lasting changes in the markets that make older data less relevant.
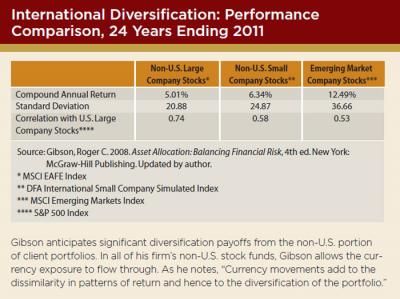
“Relative to our old assumptions,” Gibson says, “our new correlation assumptions are higher among equity asset classes and lower between bonds and the four equity asset classes we use to diversify client portfolios.” Within equity classes, international diversification has lost some but not all of its charm for Gibson. Relative to U.S. large stocks, he sees particularly attractive diversification payoffs with non-U.S. small stocks and emerging market stocks. See the sidebar for details.
In addition, Gibson likes the relatively attractive valuations of non-U.S. stocks compared with U.S. stocks:
- S&P 500 five-year normalized P/E ratio: 18.5
- MSCI Emerging Market five-year normalized P/E ratio: 13.3 (28 percent discount to U.S. stocks)
- MSCI EAFE five-year normalized P/E ratio: 12.1 (35 percent discount to U.S. stocks)
- Europe five-year normalized P/E ratio: 10.5 (43 percent discount to U.S. stocks)
Given the breadth of diversification of Gibson’s typical client portfolio, the direct exposure of clients to European securities remains fairly small, and the low non-U.S. stock P/E ratios discount a fair amount of potential risk.
Conclusion
Despite the extreme losses of 2008 and the morbid consolation that the only thing going up in a down market is correlations, our interviewees have all managed to avoid the one behavior certain to decimate portfolios—panic. Luxenberg likens investing to watching corn grow. It is not exciting and it is not supposed to be: “I’m a farmer that plants seeds and watch[es] them grow over time. Going to cash is like burning your crop because you had a bad year.”
Gibson remains an unrepentant asset allocator no matter how loud the “diworsification” media machine cranks up. He’s willing to bet the farm on diversification, and particularly strategic asset allocation. As he concludes: “Strategic asset allocation promises a longer-term portfolio compound return that is higher than the weighted-average compound returns of the asset classes used to build the portfolio. Strategic asset allocation also promises a longer-term portfolio volatility that is less than the weighted-average volatilities of the portfolio’s component asset classes. Strategic asset allocation has delivered on these promises in the past and it will deliver on these promises in the future.”
Jim Grote, CFP®, is a financial writer whose articles have also appeared in Bloomberg Wealth Manager, Family Business Review, Financial Advisor, MorningstarAdvisor.com, and Planned Giving Today. (jimgrote@hotmail.com)
Endnotes
- Soros, George. 2009. The Crash of 2008 and What It Means: The New Paradigm for Financial Markets. New York: PublicAffairs. 216.
- Lauricella, Tom. 2009. “Failure of a Fail-Safe Strategy Sends Investors Scrambling.” Wall Street Journal (July 10).
- Malkiel, Burton G. 2012. A Random Walk Down Wall Street: The Time-Tested Strategy for Successful Investing, 10th ed. New York: W. W. Norton & Company Inc. 206.
- See page 288 of the book for Gibson’s total portfolio design.
- Malkiel, ibid. 119, 160, and 271.