Journal of Financial Planning: June 2011
Gregory W. Kasten, M.D., CFP®, CPC, AIFA®, has published more than 75 papers on financial planning, retirement, and investment-related topics in various financial and business journals. Kasten founded the wealth management firm Unified Trust Company in 1985, and developed the UnifiedPlan® improve the outcomes for 401(k) participants. He wrote two editions of the book Retirement Success, and has developed the Unified Fiduciary Monitoring Index® as a method of quantifying mutual fund fiduciary and performance factors.
Michael W. Kasten is a third-year medical student at the University of Kentucky College of Medicine in Lexington, Kentucky.
Executive Summary
- The otherwise healthy senior client may experience substantial declines in cognitive function over time, even without clinical dementia. After peaking in middle age, the ability to make effective financial decisions declines. This presents the ongoing challenge to help older clients understand ever more complex retirement income planning.
- Pre-retirees and retirees tend to have hyper loss aversion. The brain sets aside rationality when it gets the benefit of supposedly expert opinion. The brain tends to give up responsibility, and instead transfers decisional authority to a perceived “expert” with little independent thought.
- Experts have recommended evaluation of two criteria for determining prudent retirement income strategies: first, clients’ emotional capacity to deal with risk and uncertainty, and second, their financial capacity to deal with variations in portfolio value, longevity, and income delivery.
- We believe a third criterion should be added—clients’ cognitive ability to grasp and integrate the implications of the retirement income solution. A new retirement income language and presentation skill set are needed to help retirees make better-informed decisions.
- Because the senior population is so vulnerable, and the impacts of financial decisions have such great consequence on their lives, we recommend that all retirement income decision planning and management be delivered by advisers serving in a true fiduciary capacity to their clients.
Both normal and abnormal aging negatively affect financial decision making. Planning retirement income is a highly complex undertaking; it requires the consumer to gather, process, and project data on compound interest, risk diversification, actuarial events, portfolio optimization, capital market forecasts, inflation, and other assumptions about future asset market performance. Unlike most simple financial decisions, the retirement planning decision is not a one-time event.
Most pre-retirees and retirees have little or no life experience with converting accumulated assets into lifetime income in the decumulation phase. This is particularly true because the trend is moving to the “automated” defined contribution plan under the Pension Protection Act of 2006 (PPA), in which the qualified default investment alternative (QDIA) and automatic enrollment tend to reduce active decision making and decrease opportunities for the typical plan participant to gain valuable experience.
Many consumers make poor financial choices, and older adults are particularly vulnerable to such errors. Recent research shows that financial illiteracy is widespread among older individuals.1 For example, researchers found only one out of three Americans age 50 or older could correctly answer simple questions about compound interest, inflation, or risk reduction through diversification.
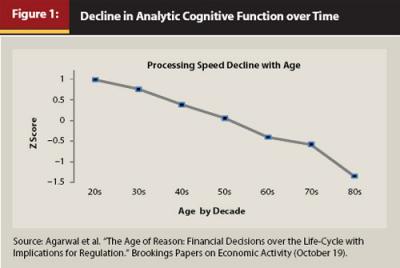
Analytic cognitive function has been found to decline dramatically over an investor’s life span, starting at age 20.2 One way to view this steady decline is to examine a person’s cognitive-function percentile score (measured relative to the total adult population) and that person’s age. In a cross-section of the population, average analytic cognitive function falls by about 1 percentile unit for each year of age (see Figure 1).
Two more relatively simple calculations show the loss of analytic performance over time. The first is the serial 7s task. This task asks the respondent to count backward by 7s from 100. The correct sequence is 100, 93, 86, etc. The respondent is scored on a one-to-five scale, with one point awarded for each successful subtraction. At age 51, the average score is 3.2 out of 5 correct numbers. By age 90, the average score is 2.2 out of 5. The second simple calculation identifies the fraction of people able to answer the question: “If five people all have the winning numbers in the lottery and the prize is $2 million, how much will each of them get?” The group correctly answering $400,000 drops steadily over time. At age 53, 52 percent answer correctly. By age 90, only 10 percent give the correct answer. Keep in mind how simple these two tasks are compared to the analysis needed to understand a lifetime retirement income program.
Age-driven declines in analytic function are partially offset by age-related increases in experience, which is sometimes called “wisdom.”3 Most day-to-day tasks rely on both analytic and experiential human capital. Over time experiential capital accumulates with diminishing returns, meaning the curve flattens as time passes, and analytic capital falls in a near linear fashion at 1 percentile per year over the life cycle.
Consequently, adults around age 50 may be at a decision-making sweet spot—they have substantial amounts of practical experience and have not yet had significant declines in analytic cognitive function. Beyond age 50, performance tends to fall.
The loss of cognitive function has an adverse effect on even simple financial decisions. Researchers have found that older clients with loss of cognitive function pay higher interest rates on home mortgages and credit cards. Other researchers have found that investors with reduced cognitive function take more risk and earn lower returns in the stock market.4
Abnormal Aging Process, Dementia, and Alzheimer’s Disease
Clinical dementia is a decline of reasoning, memory, analytical problem solving, and other higher mental abilities. As a group, these are called “cognitive” functions. The declines eventually impair the ability to carry out everyday activities such as driving, household chores, and even personal care such as bathing, dressing, and feeding. Long before these basic living declines occur, the loss of financial decision-making proficiency usually occurs.
It should never be assumed that because senior clients do not have clinical dementia or Alzheimer’s disease, they have normal cognitive function. Likewise, aging, even when accompanied by declines in cognition, does not always lead to Alzheimer’s or dementia. In fact, many senior clients will not have dementia or Alzheimer’s, but will still have difficulty making complex financial decisions and exhibit some cognitive impairment.
Dementia is most common in senior people; it used to be called senility and was considered a normal part of aging. We now know that dementia is not a normal part of aging but is caused by various underlying medical conditions that can occur in both older and younger persons. In some cases, dementia can be reversed with proper medical treatment.
Alzheimer’s disease is the most common cause of dementia, accounting for about half of all cases,5 and is at least partly hereditary. In this disease, abnormal protein deposits destroy cells in the areas of the brain that control memory and mental functions. People with Alzheimer’s disease also have lower-than-normal levels of brain chemicals called neurotransmitters that control important brain functions. Alzheimer’s disease is not reversible, and no known cure exists. However, as mentioned above, certain medications can slow its progress.
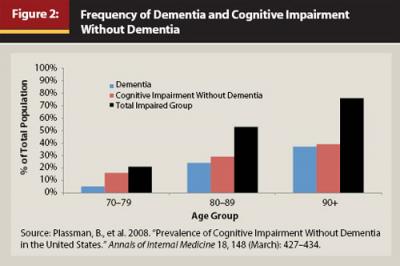
It is now becoming clear that a large part of the senior population has some cognitive impairment, especially when related to financial decision making. One of the most complete studies comes from researchers looking at the ADAMS (Aging, Demographics, and Memory Study) national sample,8 a random sample of 1,770 individuals age 70 or older from five cognitive strata based on participants’ scores on a self-reported or proxy-reported cognitive measure. What is important about this study is that it also identified individuals with cognitive impairment without full dementia symptoms. The research found that 21 percent of the population ages 70–79, 53 percent of the population ages 80–89, and 76 percent of the population age 90 or older had at least some cognitive impairment (see Figure 2).
In addition, evidence increasingly suggests that cognitive impairment is extremely common in intensive care unit (ICU) survivors,9 with almost 80 percent of ICU survivors experiencing cognitive impairment early after hospital discharge. The rate declines somewhat over time. In general, it appears that the majority of ICU survivors experience improvement in neurocognitive functioning in the first 6 to 12 months after hospital discharge. The implications for financial planning are clear. It should be assumed that any patient recently discharged from the hospital that included an ICU admission is most likely experiencing cognitive impairment until proven otherwise.

Behavioral Finance Issues Affecting Seniors
Like other investors, seniors exhibit numerous behavioral finance traits, such as inertia, anchoring, procrastination, framing, default choices, and the endorsement effect.10 Investors and consumers make choices based in large part on how the questions are framed. For example, if given two choices of ice cream—an ice cream that is 90 percent fat-free or one that is 10 percent fat, most people choose the 90 percent fat-free ice cream, even though it’s exactly the same as the 10 percent fat version. Why? Because fat-free sounds more appealing. So framing is very important when communicating with seniors.
Experienced financial planners are aware that many clients, old and young, believe losses are more important than an equivalent amount of gains. In fact, research shows investors experience the pain of a financial loss much more acutely than they feel the pleasure of the same size gain, by a factor of about two to one.11
To an even greater degree retirees display “hyper loss aversion.” In one study retirees were up to five times more loss averse than the average investor.12 Nearly half of the retirees said that they would refuse a gamble with a 50 percent chance of winning $100 and a 50 percent chance of losing as little as $10, which suggests they weighted losses about 10 times more heavily than gains. The magnitude of loss aversion was far greater than expected.
Given their loss aversion, retirees in the study displayed unexpected negative attitudes toward products designed to minimize losses. Retirees with hyper loss aversion actually responded less favorably to financial products with more protection and guarantees. They unexpectedly perceived the annuity as risky because some people will live longer than others and life expectancy was uncertain. They considered this longevity uncertainty another form of risk.
Currently, defined-benefit retirement income solutions are presented in such a way that retirees overweight certain attributes at the expense of others. For example, 69 percent of married women and 28 percent of married men opt for single-life annuities rather than joint and survivor annuities.13 It is possible some may have good reason to do so; others may be responding to the way the information they receive is presented.
Though many theoretical models point to the benefits of guaranteed lifetime income, there is very little evidence that retirees favor annuities. Generally only 2 percent to 6 percent of retirees elected guaranteed lifetime income when it was available in their 401(k) plans. The dramatic discrepancy between theoretical predictions and the actual behavior of retirees has been dubbed the “annuity puzzle.” Do we think there really is an annuity puzzle? In other words, do most retirees really choose not to purchase lifetime income? Or do seniors pick lifetime income solutions when they must make an active choice about retirement payouts and do not have the option of remaining with the status quo or a default?
Retirees in defined-benefit plans were 17 percent more likely to choose the guaranteed lifetime income than their peers in cash-balance plans. The so-called annuity puzzle may be no more than circumstantial. Active decision making and a plan context that highlights monthly income could increase the attractiveness and adoption of lifetime retirement income solutions.
Positive recent stock market returns were found to decrease the likelihood of employees choosing an annuity over a lump sum, and vice versa.14 Only recent market performance drives annuitization with almost no consideration given to returns two years or longer before the decision date. Financial education of pre-retirees does not mitigate this result. As an example, consider two employees: one retiring before the credit crisis in December 2007 and the other a year later in December 2008. Holding everything else equal, the research estimates imply that the employee retiring in December 2008 is about 25 percentage points more likely to choose an annuity.
Inertia is very common in 401(k) investors, retirees as well as younger investors in the accumulation phase.15 Plan features such as auto enrollment, default portfolios, and escalators of annual saving rates can take advantage of participants’ inertia to help them do the right thing and create positive retirement income solutions.
In their decision making, human beings do best when presented with apples-to-apples comparisons. Research shows that the ease with which a product’s attributes can be evaluated and compared strongly influences decisions.16 However, by focusing on the easiest aspects of a decision, people do not always make optimal choices.
Experts suggest that a new language is needed to help retirees make better-informed decisions.17 This language would avoid jargon. It would make a product’s attributes more meaningful, easier to understand, and more graphical or imaged-based. It would facilitate an apples-to-apples comparison between offerings. Similar to the energy usage labels on appliances, or EPA gas mileage estimates on new cars, the industry jargon is given context by providing a scale. Consumers can evaluate a potential purchase by seeing where its performance lies along the visual scale—closer to the end that represents less efficiency or the end that represents higher efficiency.
The Retirement Income Solution Calls for Fiduciary Oversight
Many financial decisions involve uncertainty, or imperfect knowledge about how choices lead to outcomes.18 Investors continually face trade-offs between options that promise safety and others that offer an uncertain potential for jackpot or bust. When mechanisms for evaluating uncertain outcomes fail, as in mental disorders or normal aging, the results can be disastrous.
Recent research on brain anatomy and cognitive function shows how the brain sets aside rationality when it gets the benefit of supposedly “expert” opinion.19 The study shows that when a financial expert recommends a financial solution to a complex situation, clients tend to give up responsibility and defer to authority with little independent thought. The expert advice suppresses activity in a neural circuit that is critical to sound decision making and value judgments.
The behavioral results indicate that experts’ advice significantly influences behavior. Pre-retirees and retirees making complex retirement income decisions are likely to be especially susceptible to uncritical trust of experts in times of economic uncertainty. The results explain why seniors are likely to follow a financial adviser’s recommendations blindly, when a little reflection might be sufficient to suggest a more prudent course of action. The study makes clear why such clients are best served in a fiduciary relationship.
The largest financial purchase most Americans will make in their lifetime is not their home purchase but their retirement income purchase.20 Yet most spend less time on the retirement decision and monitoring the ongoing lifetime process than they do on a one-time hotel decision for a short vacation. Most investors and retirement plan participants have great difficulty mathematically converting the monthly or annual income required for the duration of their retirement into a lump-sum figure at the beginning of retirement. Most clients significantly and consistently underestimate the lump-sum figure, believing that two or three years’ worth of income is the size of the lump sum.
Given the magnitude of the retirement income decision, a key question is, “Should the decision be made in a fiduciary environment, or is simple disclosure enough through the normal sales process?” The answer is clear that pre-retiree and retiree clients are best served in a fiduciary environment because of the scale of information asymmetry between retirement income clients and investment professionals today. Senior clients cannot be presumed able to effectively judge the myriad of facts and circumstances surrounding markets, risks, and products constituting a very complex retirement income plan, and then make a decision that is truly informed. They cannot second guess an adviser or broker any more than patients can be presumed able to effectively and seriously question their physicians.
Conflicts of interest can lead experts to give biased and corrupt advice. Although disclosure is often proposed as a potential solution to these problems, disclosure is generally ineffective and can make matters worse.21 First, investors usually do not discount advice from biased advisers as much as they should, even when advisers’ conflicts of interest are honestly disclosed. Second, disclosure can increase the bias in advice because it leads advisers to feel morally licensed and given permission to exaggerate their advice. This means that while disclosure may warn senior clients to discount an expert opinion, disclosure might also lead experts to alter the opinion they offer in such a way as to overcompensate for any discounting that might occur. In addition, as described earlier, when presented with complexity, senior clients will likely offload the decision to experts. When the offloading occurs, disclosures are moot. Indeed, one group of experts has recently proposed that the use of a fiduciary be mandatory for all major financial decisions.22
Evaluating Retirement Income Solutions for Seniors
After all is said and done, what people want most during retirement is flexibility, comfort, safety, and some control. They want to go to sleep at night knowing they will be able to maintain the kind of retirement they were hoping and planning for. Like most car owners, they really do not want to read the owner’s manual.
Financial planners want more insight into best practices and peer benchmarks related to retirement income support. They are looking for more information about what works and what doesn’t. They want help in finding and evaluating retirement income solutions and assistance in refining their current processes. Financial planners must be sure to match solutions to the goals of individual clients.
There are many choices available to financial planners to generate retirement income:
- Systematic withdrawal from an investment portfolio using “safe” withdrawal rates
- Managed payout funds
- Target-date funds
- Zero-coupon bonds’ income floor
- Bond ladders
- TIPS’ income floor
- The “bucket approach,” with specific time sequences for various asset classes
- Traditional fixed-income lifetime annuities
- A variable annuity with or without guaranteed payout fractions
- Some combination of the above
Retirement costs can be divided into essential and discretionary expenses. The essential expenses are the “must haves,” such as medical care, housing, food, utilities, etc. Discretionary expenses include items such as travel, gifting, or luxury purchases. Michael Zwecher advocates a very conservative income-floor approach to cover essential expenses with guaranteed fixed annuities, TIPS, or zero-coupon bonds.23
How do you decide which strategy to follow and which combination of products to use? No one solution can effectively deal with market, inflation, longevity, medical, economic, credit, and future spending risks. What works for one client may be disastrous for another. Jim Otar recommends evaluation of two critical factors: first, clients’ emotional capacity to deal with risk and uncertainty, and second, their financial capacity to deal with variations in portfolio value and income delivery.24 We believe a third category should be added, which is clients’ cognitive ability to grasp and integrate all the financial implications of the retirement income solution. Only by taking into account all three variables can you decide which strategy to follow and propose.
Some of the concepts currently used, such as the bucket approach, are more for client comfort than material impact on outcomes. Our research using multiple Monte Carlo models has demonstrated there is no improvement in portfolio survival merely by adding buckets. A bucket strategy with an overall 40 percent equity and 60 percent fixed-income mix has the same long-term survival as a single 40:60 balanced portfolio, assuming both are using the same real annual withdrawal rate. But that does not mean buckets are not helpful and shouldn’t be used; the visual illustration of buckets can help clients feel more comfortable and not panic and sell out at periodic market bottoms. The success of the retirement income program is driven as much by investor behavior as it is by investment performance.
To deal with behavioral problems, a “withdrawal policy statement” can be used to articulate the goals and policies as well as the strategies and tactics clients and advisers agree to adopt to guide future decision making around portfolio withdrawals.25 Based on this agreement, clients could give advisers discretion over any or all of the provisions in the statement.
In addition to goal, policy, and harvesting declarations as described above, a statement could specify: (1) the client income goals to be met via withdrawals, (2) the client assets to which the process applies, (3) the initial withdrawal rate, (4) the method for determining the source of each year’s withdrawal income from the portfolio, and (5) the method for determining the withdrawal amount in subsequent years, including both the trigger points for adjustments other than an inflation-based increase and the magnitude of the adjustment itself. The statement would govern harvesting based upon asset sales to fund cash withdrawals and harvesting bucket fulfillment.
Harvesting can be a useful way to improve the retirement income process. In this context, harvesting can be used in two ways. First, the traditional method to harvest the cash for future withdrawals in retirement has usually been to rebalance to a target equity-fixed split. The idea was to maintain a constant risk level with which the retiree would be comfortable during bull and bear market cycles. However, our research along with other studies has explored the idea of using alternative methods to harvest withdrawals from a retirement portfolio.26
In the dynamic rebalancing technique, the withdrawal is taken from the asset class with the highest return in the prior year. When stocks return more than fixed income, in the year following, the withdrawal is taken from stocks, and vice versa. Such an approach will improve Monte Carlo success probability by 10 percent to 18 percent over a static allocation.27 Second, when a bucket approach is used, if the forecast future value of the bucket is reached prematurely, it can be harvested by moving the assets to a much more conservative investment to lock in the needed future value to fund the period of retirement income for that designated bucket.
Presenting Retirement Income Solutions to Seniors
Even for the mentally healthy pre-retiree, effective presentation is as much visual as verbal. The retirement income planning industry must use a new language and a more consistent or standardized presentation method to help retirees make better-informed decisions. Explaining the retirement income management process is much more than simply showing asset allocation or performance of the portfolio against a benchmark such as the S&P 500. Retirees are much more interested in the sustainability and reliability of their lifetime income stream. We should consider new types of reporting to concisely communicate more to clients about how their retirement is progressing. The need to avoid jargon is important, and relative visual or graphical scales help communicate the message. The report should be easy to understand, with a graphical summary page and with details placed in the body and appendix.
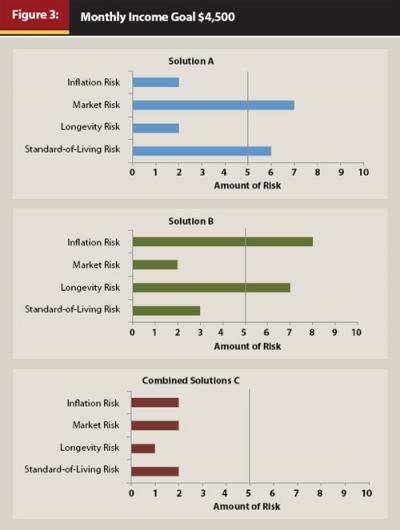
An example of a simple graphical image is shown in Figure 3. It illustrates on a simple scale the relative merits of each solution. It illustrates the lifetime monthly income expectation and the capacity of the solution to mitigate the various risks clients face. The goal is to hit the target income with as little risk or uncertainty as possible. Solution A deals with longevity and inflation risk, but exposes the client to market and possibly future lower standard-of-living risks. Solution B deals with market and lower standard-of-living risks, but exposes the client to inflation and longevity risks. Combined Solution C deals most effectively with all risks and still meets the income goal.
The proposal summary explanation should avoid jargon (“time value of money,” “real return,” “standard deviation,” “black swan,” etc.) and encourage visual presentation methods that provide context and help retirees compare products. This approach would make the features and attributes of a simple product, or firm-wide income process, more meaningful. It would facilitate an apples-to-apples comparison between complex offerings. Consumers can evaluate a potential purchase by seeing where its performance lies along the visual scale—closer to the end that represents value or ability to deal with risk.
The following topics might be displayed in the retirement income report:
- Current Year Income Plan. The current year income plan illustrates the expected monthly distributions from the portfolio for the upcoming 12 months. It also analyzes total income from all sources such as Social Security and other retirement plans, and compares the upcoming annual income to last year to see if the amounts are similar.
- Future Years Income Plan. This section analyzes income beyond the current year over the life expectancy of the client. It may also include joint life analysis and longevity analysis protection. It may use bucket illustrations.
- Income Sustainability Analysis with Safety Review. This section of the report looks to see whether the income is likely to be sustainable. It takes into account Otar Withdrawal Zones,28 age-adjusted safe withdrawal rates, simple deterministic models, and Monte Carlo probability. Longevity analysis and longevity risk protection is also included. The safety of the portfolio, meaning the unpredictability or volatility in relation to income generation, is also reviewed. A composite result is presented simply.
- Time-Segment (Buckets) Analysis. The portfolio for illustrative purposes is divided into at least three or more segments or virtual buckets.
- Annuity or Longevity Insurance Information. This would be the guaranteed income section either as a lifetime income floor or a longevity risk protection allocation to provide income at a specific later date, such as after age 85.
- Asset Allocation and Asset Quality. This is similar to typical portfolio evaluation software reporting.
- Portfolio Optimization, Risk and Return Forecasts. This section deals with showing how the asset allocation is optimized. Also, future return and risk analysis is covered. Risk is more than just portfolio risk and may also include retirement income risks and longevity risks.
- Current Strategy and Any Proposed Changes. The current investment strategy covering asset allocation, asset quality, and retirement income generation is discussed. Any tactical asset allocation, market shifts, or other steps that need to be taken to increase the sustainability of retirement income or raise the portfolio returns are discussed. If any steps were taken during the quarter, they are also discussed.
- Historical Account Performance Review, Benchmarking, and Other Fiduciary Reporting Metrics. This is similar to the more standard portfolio performance software and shows the client their investment performance against relevant benchmarks.
- Fiduciary Review. The fiduciary review includes CEFEX (www.cefex.org) Self-Assessment of Fiduciary Excellence (SAFE). It includes fiduciary administrative actions. It should be noted that the proposed Department of Labor (DOL) investment advice regulations require that the portfolio be managed by generally accepted investment theories and other DOL criteria (such as fee consideration).
- DOL Annuity Selection Safe Harbor Review. The DOL annuity safe harbor criteria should be reviewed if the account holds an annuity.29 Although this safe harbor is for ERISA-defined contribution plans, the guiding principles can be applied to other fiduciary accounts such as IRAs. The fiduciary should engage in an objective and analytical search to select annuity providers; appropriately consider and conclude that at the time of the selection, the annuity provider is financially able to make all future payments under the annuity contract and the cost of the annuity contract is reasonable in relation to the benefits and administrative services provided under the contract; and if necessary, consult with an expert.
Communicating Effectively with Seniors
Communication with clients experiencing dementia is more challenging. Clients with dementia may have a limited attention span; they may find it difficult to follow long conversations. Such clients will generally be more alert in the morning and less alert as the day drags on.30 People with dementia may attempt to describe an object that they cannot name, or create a word to describe the object. Because these people are only able to focus on one thought at a time, multiple-step instructions may lead to confusion.
Short-term memory problems often lead clients with dementia to lose their train of thought or to repeat thoughts again and again. They may quickly forget what they did understand at the beginning of the conversation. Background distractions such as television or nearby conversations can compete for their attention and impair conversations and communication with them.
Clients with dementia usually need much more time than the average person to respond to a question.31 Financial planners must allow them enough time to process questions and formulate responses. A recent paper gave a good overview of how to communicate with people with dementia or Alzheimer’s.32 Working with clients who have Alzheimer’s or other progressive forms of dementia can be very challenging and presents risks to your firm. Proactive planning will improve life for your client, your client’s caregiver, and you. A written policy for how you will work with clients with dementia may help you avoid ethical and legal dilemmas.
An important discussion to have with an older client and his or her current or future caregivers is the role of appointing a trusted individual to serve as power of attorney. The power is implemented if the client becomes incapacitated. Many states divide the appointment of an agent into two types of statutory powers: property and health care. A property power allows appointment of an agent who can act in whatever financial or asset matters delegated. It can be as broad or narrow as the client specifies. A health-care power allows for the appointment of an agent to make health-care decisions on the client’s behalf.
Procedures and policies for working with them will help your clients and protect your firm. Knowing how to communicate with clients who have dementia will also improve your ability to serve them efficiently and effectively.
Endnotes
- Lusardi, A., and O. Mitchell. 2009. “How Ordinary Consumers Make Complex Economic Decisions: Financial Literacy and Retirement Readiness.” NBER Working Paper No. w15350 (August). http://ssrn.com/abstract=1472288.
- Agarwal, S., et al. 2009. “The Age of Reason: Financial Decisions over the Life Cycle with Implications for Regulation.” Brookings Papers on Economic Activity (October 19).
- Salthouse, T., D. Schroeder, and E. Ferrer. 2004. “Estimating Retest Effects in Longitudinal Assessments of Cognitive Functioning in Adults Between 18 and 60 Years of Age.” Developmental Psychology 40, 5: 813–822.
- Korniotis, G., and A. Kumar. 2005. “Cognitive Abilities, Investor Sophistication, and Investment Decisions.” In Behavioral Finance, edited by Kent Baker and John Nofsinger. Hoboken, NJ: John Wiley and Sons.
- National Institutes of Health. “Alzheimer’s Disease Fact Sheet.” www.nia.nih.gov/Alzheimers.
- Drachman, D. 2005. “Do We Have Brain to Spare?” Neurology 64, 12: 2004–2005.
- Wang, Mingshi, and Ligun Wang. 2001. “Localization of the Brain Calculation Function Area with MRI.” Chinese Science Bulletin (January).
- Plassman, B., et al. 2008. “Prevalence of Cognitive Impairment Without Dementia in the United States.” Annals of Internal Medicine 18, 148 (March): 427–434.
- Hopkins, R., and J. Jackson. 2009. “Cognitive and Functional Outcomes After ICU Admission.” Pulmonary and Critical Care Update.
- Kasten, G. 2005. Retirement Success. Unified Trust Company. 109–159.
- Kahneman, Daniel, and Amos Tversky. 1979. “Prospect Theory: An Analysis of Decision Under Risk.” Econometrica 47: 263–291.
- Benartzi, S. 2010. “Hyper Loss Aversion: Retirees Show Extremely High Sensitivity to Loss, But Shy Away from Guarantees That Require Giving Up Control.” Based on interview with Eric Johnson in Behavioral Finance and the Post-Retirement Crisis, prepared and submitted on behalf of Allianz in response to Department of the Treasury/Department of Labor Request for Information regarding lifetime income options in retirement plans (April).
- Johnson, R., et al. 2003. “Single Life vs. Joint and Survivor Pension Payout Options: How Do Married Retirees Choose?” Final Report to the Society of Actuaries and the Actuarial Foundation. Urban Institute.
- Previtero, A. 2010. “Stock Market Returns and Annuitization.” Accessed February 15: http://ssrn.com/abstract=1571997.
- Madrian, B., and D. Shea. 2001. “The Power of Suggestion: Inertia in 401(k) Participation and Savings Behavior.” Quarterly Journal of Economics 116, 4 (November): 1149–525.
- Hsee, C. K. 1996. “The Evaluability Hypothesis: An Explanation for Preference Reversals Between Joint and Separate Evaluations of Alternatives.” Organizational Behavior and Human Decision Processes 67: 247–257.
- Payne, J. 2010. “Evaluability: When Assessing Their Options, Retirees Gravitate Toward Those That Are Easiest to Understand.” Behavioral Finance and the Post-Retirement Crisis. Allianz DOL RFI Response, edited by Shlomo Benartzi (April 29).
- Platt. M. L., and S. Huettel. 2008. “Risky Business: The Neuroeconomics of Decision Making Under Uncertainty.” Natural Neuroscience 11: 398–403.
- Engelmann, J. B., et al. 2009. “Expert Financial Advice Neurobiologically ‘Offloads’ Financial Decision Making Under Risk.” PLoS ONE 4, 3: e4957.
- Kasten, G. 2009. “The Defined Goal Retirement Plan.” Journal of Pension Benefits 17, 1 (Autumn): 23–44.
- Cain, D., et al. 2003. “The Dirt on Coming Clean: Perverse Effects of Disclosing Conflicts of Interest” (December 1). http://ssrn.com/abstract=480121.
- Agarwal, A., et al. 2009. “The Age of Reason: Financial Decisions over the Life-Cycle with Implications for Regulation” (October 19). Paper prepared for the Brookings Papers on Economic Activity. http://ssrn.com/abstract=973790.
- Zwecher, M. 2010. Retirement Portfolios: Theory, Construction, and Management. Hoboken, NJ: John Wiley and Sons.
- Otar, J. 2009. Unveiling the Retirement Myth. Thornhill, ON: Otar and Associates.
- Guyton, J. 2010. “The Withdrawal Policy Statement.” Journal of Financial Planning (June).
- Weiss, G. 2008. “Dynamic Rebalancing.” Journal of Financial Planning (September).
- Kasten, Greg. Unpublished research.
- Otar, Unveiling the Retirement Myth.
- 2008. “Selection of Annuity Providers—Safe Harbor for Individual Account Plans.” Federal Register 73, 195 (October 7): 58447–58450.
- Dixon, R., L. Backman, and L. Nilsson. 2004. New Frontiers in Cognitive Aging. New York: Oxford University Press.
- Schwartz, D. 2000. Cognitive Aging: A Primer. New York: Taylor and Francis.
- Starnes, S. 2010. “Is Your Firm Prepared for Alzheimer’s? How to Communicate with Clients with Dementia.” Journal of Financial Planning (December).