Journal of Financial Planning: January 2017
Jon M. Luskin, CFP®, is a financial planner with Define Financial, a fee-only planning firm based in San Diego, California, and an active member of the FPA of San Diego NexGen group. For his master’s thesis, Luskin showed how university endowments can generate more wealth and take on less risk by adopting simpler investment strategies.
Acknowledgement: The author thanks Meghaan Lurtz, personal financial planning doctoral student at Kansas State University, for her editing help.
Executive Summary
- Previous research has usually shown that dollar-cost averaging underperformed lump-sum investing. However, the body of existing research has not closely examined the circumstances of this outperformance.
- Concurrent with existing research, this paper found that lump-sum investing outperformed dollar-cost averaging roughly two-thirds of the time on a nominal return basis, when ignoring taxes and transaction costs.
- The likelihood of dollar-cost averaging outperformance over lump-sum investing is a function of the cyclically adjusted price-to-earnings (CAPE) ratio at the beginning of the investment period, with higher CAPE ratios linked to dollar-cost averaging outperformance.
- This paper discusses entry-level investment analysis.
Investment advisers have continued to practice dollar-cost averaging despite its demonstrated inferior returns compared to lump-sum investing (Williams and Bacon 1993; Shtekhman, Tasopoulos, and Wimmer 2012). However, lump-sum investing has not conclusively eclipsed dollar-cost averaging; it has outperformed dollar-cost averaging only two-thirds of the time (Shtekhman et al. 2012; Williams and Bacon 1993). Certain periods of flat stock market performance (Williams and Bacon 1993), and downward-trending markets (Greenhut 2006) point to the superior nominal investment return with dollar-cost averaging. This presents the research question: is there a common underlying factor that influences dollar-cost averaging outperformance of lump-sum investing?
This study sought to identify an environmental pattern in dollar-cost averaging’s higher returns over lump-sum investing.
In practice, dollar-cost averaging is most effective as a behavioral finance tool (Statman 1995). Investment advisers proposing a dollar-cost averaging approach have likely done so in an effort to reduce risk and minimize potential emotional regret on behalf of the client, not grow assets (Dubil 2005). Thus, even though dollar-cost averaging is not conventionally used as a superior wealth-generation tool, are there still opportunities for it to be an effective portfolio strategy?
Conceptual Framework
The most important concepts and their definitions and acronyms are as follows:
Dollar-cost averaging (DCA) is the process of making a regular deposit at a regular time interval. For example, instead of investing $1,200 on January 1, $100 is invested on the first of every month.
As mentioned, DCA is traditionally used as a risk mitigation strategy; DCA may prevent or palliate buyer’s remorse in the event of a market crash or correction. DCA systematically invests small amounts over time and assists clients in mentally navigating the proverbial concern of “going all in.”
Lump-sum investing (LSI) takes the opposite approach. LSI requires investing the entirety of an available asset at the inception of the investment period, instead of making smaller investments over time.
The Shiller Price-to-Earnings (P/E) 10 is a stock market valuation metric based on the average corporate earnings of domestic companies over the last 10 years. This metric adjusts for inflation and is also known as the cyclically adjusted P/E (CAPE) ratio.
A Theoretical Overview: Known and Hypothetical Relationships
Positive long-term market returns. On average, LSI has outperformed DCA given the stock market’s historical upward trend. This upward trend is most prominent on long timelines, such as 15 years or greater. Inherent stock market volatility, however, may create short-term losses. As noted in other literature, volatility and downward markets have proved DCA to be the superior investment strategy, producing a higher nominal investment return than LSI (Greenhut 2006, Williams and Bacon 1993).
Risk and return. Risk and return are positively correlated: a single asset class generates a greater expected investment return at the consequence of greater risk. Complimentary to this theory is the principle that DCA is traditionally less risky than LSI (Dubil 2005; Kitces 2016). A DCA strategy, on average and over time, holds more cash than a LSI strategy. Holding cash or cash equivalents has historically proven to be less volatile than holding domestic equities. Therefore, a traditional portfolio holding a greater proportion of cash, on average, will be subject to less risk. The opposite is also true; the portfolio holding a greater proportion of equities will be riskier and should, theoretically, generate higher investment returns.
Despite the previous principles, certain periods have exhibited the dominance of a DCA strategy over LSI. DCA has produced higher nominal investment returns given flat, downward-trending, or volatile market conditions (Shtekhman et al. 2012).
Tactical asset allocation and multi-year valuation metrics. Related to DCA is the concept of tactical asset allocation—adjusting portfolio allocation in response to dynamic market variables. One variable that affects allocation is equity valuation (the CAPE ratio is one method for measuring equity valuation). Adjusting portfolio allocation in response to changes in equity valuation has been shown to produce superior nominal investment returns relative to a strategic (i.e., static) portfolio. Research has shown that in highly valued markets, a tactical portfolio with equities underweighted can outperform a static portfolio. The inverse was also found; given supposed low market valuations, a portfolio with equities over-weighted would outperform a static portfolio (Solow, Kitces, and Locatelli 2011).
Modern portfolio theory. As mentioned, the traditional risk/return principle posits that greater investment return can only be achieved by enduring greater risk when investing in a single asset class. However, a DCA strategy uses a portfolio composed of two very distinct asset classes: equities and cash. Juxtaposing distinct asset classes within the same portfolio is a principle of modern portfolio theory, which posits superior risk-adjusted performance is available when holding asset classes with low correlation to each other (Markowitz 1952).
Research Question Addressed in This Study
A multi-year valuation metric has been shown to be a successful tool for producing excess investment returns (Solow et al. 2011). As such, the CAPE ratio (a multi-year valuation metric) may also be useful in indicating the standards and circumstance by which a decision to employ DCA or LSI is made.
The research question addressed in this study is: Can a pattern of market valuation be identified that alerts investment advisers to when using DCA may be the superior strategy—generating a higher nominal investment return over LSI?
Literature Review
When back-testing historical data using one or more indices or individual domestic equities, LSI usually generated superior nominal and risk-adjusted investment returns over DCA (Williams and Bacon 1993; Shtekhman et al. 2012; Leggio and Lien 2003). Previous studies provided insight into DCA’s circumstantial dominance yet neglected a detailed discussion of determining factors. This paper intends to pick up where that previous research left off.
Shtekhman et al. (2012) reviewed historical data from the equity markets of three different first-world countries from 1926 to 2011, examining periods between one and 30 years. They found in congruence with existing research, DCA only outperformed LSI one-third of the time. In those circumstances where DCA outperformed, the authors explained, “ … we found that DCA performed better during market downturns, so DCA may be a logical alternative for investors who prefer some short-term downside protection” (page 6).
Williams and Bacon (1993) studied one-year holding periods, investigating the value of DCA in the domestic market. The period analyzed ran from 1926 to 1991. The authors reached a similar conclusion to Shtekhman et al. (2012): LSI outperformed two-thirds of the time. The authors noted the following exception: “The success of lump-sum investing was somewhat less during the 1970–91 period because of the poor performance of the stock market during much of the 1970s” (Williams and Bacon 1993, page 66).
Greenhut (2006) examined individual companies, as opposed to market indices, over 10 years from 1995 through 2004. His study highlighted the same observation: “ … the performance of DCA rests on the trend in stock prices, with DCA outperforming in downward markets and lump sum outperforming in upward markets” (page 76).
Using the CAPE Ratio
Distinct from DCA, previous research has been done using a five-year normalized price-to-earnings (P/E) ratio. This five-year normalized P/E ratio has been used as a guide for equity weightings in a portfolio, tilting portfolio allocations (toward more or less equity). Solow et al. (2011) reviewed monthly data of domestic equities and United States government bonds from 1926 through 2010; five-year investment returns were analyzed. The results suggested that high market valuations should prompt investors to lower equity allocation (and vice versa). In the Solow et al. (2011) study, the five-year normalized P/E ratio was demonstrated to be a valid metric for selecting the “tilting” investment strategy to generate the greatest wealth. Therefore, this signaled using a multi-year valuation ratio as the basis for analysis for employing a DCA strategy. The CAPE ratio was selected as the multi-year valuation metric given its ubiquity and the ease at which advisers can access CAPE ratio data (from Robert Shiller’s webpage at Yale University, www.econ.yale.edu/~shiller/data.htm).
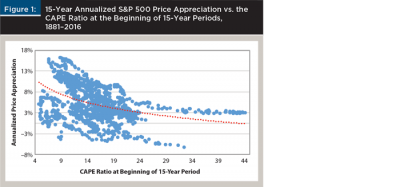
The CAPE ratio as a predictor of price appreciation. Shiller’s CAPE ratio has some predictive power as a valuation metric. Figure 1 juxtaposes S&P 500 price appreciation to valuation, as measured by the CAPE ratio. Note the trend line in red in Figure 1. The data shows a significant negative correlation (–0.41) between S&P 500 price appreciation and the CAPE ratio at the beginning of the 15-year periods.
Challenges of using the CAPE ratio. The CAPE ratio may be an imperfect valuation metric. One challenge of using the CAPE ratio is that it covers 10 years of data. Ten years may be longer than a business cycle. Further, while the CAPE ratio does adjust for inflation (i.e., it is normalized), the technique for measuring inflation has changed with time. Accounting standards and corporate taxation have also changed over time (Wilcox 2011).
The existing research has only summarily stated that DCA has performed well in periods of volatility, and has fallen short of researching, employing, and offering strategies for executing DCA.
The concept is relatively simple: buy low and sell high. If the investment adviser is confident that future market lows are coming (because of a current market high), DCA gives reason and process for one to postpone investing the majority of their asset pool. The investor using DCA has the opportunity to buy lower later, after market valuations have normalized or inverted below mean valuations.
What makes this study significant, with respect to the existing literature, is the evaluation technique. Previous work has evaluated whether LSI or DCA is better. This study sought to determine why. Again, the prior literature on DCA has fallen short of offering a possible strategy to capitalize on those identified market trends where DCA outperformed. This paper utilized a demonstrated evaluation strategy, CAPE/Shiller P/E 10, to inform and enable advisers so they make take advantage of DCA. The CAPE ratio at the beginning of each hypothetical 15-year holding period was considered relative to historical averages. The performance of both DCA and LSI strategies were considered over the same period. The difference in investment performance between the two investment strategies (and which one is superior) was considered relative to that period’s starting CAPE ratio.
Methodology
Data. The investment returns of the LSI strategy and the DCA strategy were compared for rolling 15-year periods. Historic CAPE ratio metrics were sourced from Robert Shiller’s webpage at Yale University (www.econ.yale.edu/~shiller/data.htm). Ten- and five-year periods were also tested, but 15 years was used because it enabled the greatest chance for the outperformance by DCA.
The adjusted close price of the S&P 500 was sourced from Yahoo! Finance (finance.yahoo.com). The adjusted close price incorporates dividend re-investment and stock splits (instead of price appreciation alone) to arrive at the greater figure of total return. Using the adjusted close price mimics the investment return available to an investor re-investing dividends.
Historical risk-free rate (three-month Treasury bill) performance data was sourced from the Board of Governors of the Federal Reserve System (federal
reserve.gov/releases/h15/data.htm).
The period analyzed spanned January 1950 through December 2015. This investment data was available monthly. This particular period was chosen because of the availability of performance data of the S&P 500 total returns (i.e., dividends re-invested, etc.).
Calculating Nominal Investment Returns
LSI returns were computed by dividing the S&P 500 ending adjusted close price by the beginning adjusted close price and subtracting 1. DCA returns were calculated by making equal monthly investments over the equivalent period, 180 investments for each 15-year period. Cash in the DCA portfolio not yet invested grew at the risk-free rate for the respective period (i.e., 1.07 percent in January 1950, 10.12 percent in July 1984, etc.). The geometric mean of the portfolio employing LSI was compared to the geometric mean of the portfolio employing DCA to determine which portfolio offered the greatest return. All returns are nominal. There was no consideration for inflation or risk-adjusted return.
Taxes and transaction costs were ignored. Additionally, there was no consideration for expense ratios, loads, or commissions. In a real-world scenario, the absence of taxes and transaction costs could occur in a tax-sheltered account using commission-free and load-free investments. For example, one real-life possibility could be an IRA account held at an investment custodian that issues their own proprietary index funds. Being an index fund, there would only be a nominal expense ratio. Being a proprietary fund offered directly through the investment custodian, there could be no commission, no load, and no account maintenance fees.
Limitations on Available Data
The period explored in this study ran from 1950 through 2015. While the period was more extensive than some previous studies, it did not cover the entirety of the market’s history. The limitations on easily accessible data on risk-free rates (three-month Treasury bill) as well as the total return (with dividends re-invested, etc.) of the domestic equity market prevented this study from spanning back to the late 1800s when Shiller’s data on the CAPE ratio begins.
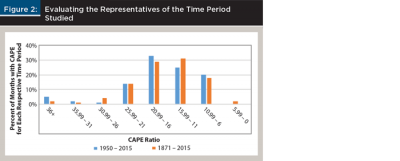
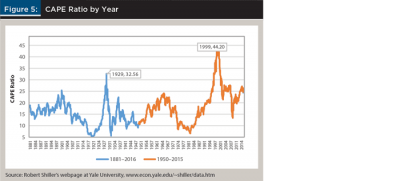
With respect to CAPE ratio valuations, the period analyzed (1950–2015) was somewhat representative of the broader historical market data, according to data from the Fed, Yahoo! Finance, and Damodaran 2016 (see Figure 2). The period analyzed by Shiller, 1871–2015, (illustrated in orange in Figure 2) displays more of a conventional bell curve distribution of valuations. The shorter time period examined (illustrated in blue) skews higher market valuations than the historic average. Note the fat tail for extreme market valuations (36+), and the lack of any exceptionally low market valuations (5.99 – 0).
Hypotheses
Previous research has shown DCA to outperform LSI one-third of the time on a nominal return basis (Shtekhman et al. 2012; Williams and Bacon 1993). Moreover, it was observed through Shiller’s webpage (www.econ.yale.edu/~shiller/data.htm) that two-thirds of the time, CAPE ratio valuations have been less than 18.6 when looking at CAPE ratio valuations monthly from 1871 through 2015. Therefore, it was hypothesized for this paper that:
Null hypothesis: CAPE ratio valuations greater than 18.6 (as measured at the beginning of 15-year rolling time periods) will not manifest superior nominal investments returns when using DCA, with CAPE ratio valuations below 18.6 not showing superior investments returns with LSI.
Alternative hypothesis: CAPE ratio valuations greater than 18.6 (as measured at the beginning of 15-year rolling time periods) will manifest superior nominal investments returns when using DCA, with CAPE ratio valuations below 18.6 showing superior investment returns with LSI.
Findings
Nominal investment return: DCA and the CAPE ratio. When breaking up the starting Shiller P/E 10 for a 15-year period and the frequency of outperformance of DCA (relative to LSI), a correlation of 0.43 existed (see Figure 3). The visualization of the data demonstrates the positive relationship between an increase in the beginning CAPE ratio of the 15-year time period and the degree of DCA outperformance: a higher starting CAPE ratio usually meant greater outperformance with DCA.
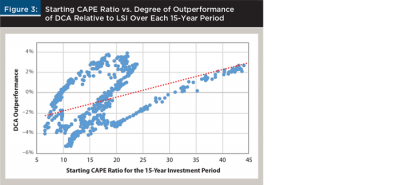
Note the red trend line in Figure 3. Extreme-valued environments (defined by a CAPE ratio greater than 31) always produced superior results with a DCA strategy.
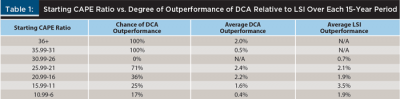
Table 1 breaks down the frequency and degree of outperformance for a given range of starting CAPE ratio for the 15-year period.
Although a higher CAPE ratio at the start of the 15-year investment period delivered a higher probability of DCA outperformance, the relationship is not strictly linear (see Figure 4).
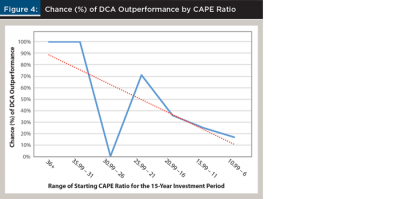
Frequency of DCA Outperformance
Investment periods with a starting CAPE ratio below 18.6 averaged investment returns of 1.44 percent per annum higher when employing a LSI strategy. For those investment periods with a beginning CAPE ratio greater than 18.6, DCA averaged investment returns 0.45 percent greater than LSI. As per the literature, DCA did outperform LSI roughly one-third of the time, or 234 out of 613 periods. This is despite the use of different methodologies, as well as different time periods than those examined in the literature review
Conclusions
The results failed to reject the null hypothesis: CAPE ratio valuations above 18.6 proved to provide, on average, superior nominal investment returns when using DCA.
This paper sought to examine possible, identifiable trends influencing DCA outperformance over LSI. As demonstrated by the analysis, CAPE ratio valuations at the beginning of a 15-year investment period proved to be a valuable indicator for selecting the optimum investment strategy that will generate the greatest investor wealth.
As shown in Figure 3, there was a clear positive correlation between the chance of DCA outperformance and the starting CAPE ratio of the 15-year period. The greater the starting CAPE ratio, the greater the likelihood of, and degree of, DCA outperformance. Extreme market valuations (those with a CAPE ratio above 31) consistently (100 percent of the time) provided superior investment returns using DCA. In short, a high CAPE ratio warrants serious consideration of a DCA strategy—not because of risk reduction or client mollification, but because of superior wealth generation.
Previous research showed that LSI was superior to DCA most of the time (Atra and Mann 2001; Shtekhman et al. 2012; Greenhut 2006; Williams and Bacon 1993). This research has added to the literature in that it provided advisers with a process for how to recognize and capitalize on market environments in which DCA outperforms LSI. This study identified, using previous literature, trends that support DCA as a wealth optimization strategy, and then hypothesized how to best measure and implement the profitability of a DCA strategy. This study demonstrates and provides a repeatable process for advisers to look at DCA as an effective tool for investors in high CAPE ratio environments.
Using DCA amidst high market valuations is similar to the Solow et al. (2011) strategy utilizing tactical asset allocation. Both strategies suggest placing less of the available funds into equities in highly valued markets. The strategies instead allocate funds to more conservative holdings. Therefore, it should come as no surprise that both studies (which tested extremely similar strategies) reached the same conclusion; superior nominal investment performance was available when less of the available amount for investment was put into equities during a highly valued market.
Practical Recommendations and Applications
If an investment adviser is considering utilizing DCA for its potential to generate superior investment returns, then that adviser should review current market valuations using the CAPE ratio. This paper reached the same conclusion as previous research: DCA outperformed LSI one-third of the time on a nominal return basis. Yet, this paper added an investigation of market trends and found that when market valuations as measured by the CAPE ratio were above roughly 18.6, this correlated with DCA outperformance (average CAPE ratio valuations being roughly 16). Therefore, if market valuations are above 18.6, an adviser should consider DCA for its superior ability to generate wealth. Evaluating the current domestic equity market valuation is easily accessible (at no cost) via the data on Robert Shiller’s website at Yale.
To put the potential value of using a DCA strategy into context, consider an example: given an initial investment of $1 million DCA presents the opportunity to generate an additional $150,000 in wealth over the 15-year period. This assumes the average investment return premium of DCA over LSI at CAPE ratio valuations above 18.6 (0.45 percent), and that equity markets return 6 percent annually.
This study also showed that during the tech bubble mere above-average valuations (CAPE ratio of 21 to 26) climbed even higher amidst the irrational exuberance of investors (Shiller 2000). It was the process of moving from an already high to an even higher valued market that made for the underperformance of DCA during that period (see Figure 5).
It is impossible to know if today’s above-average (but not extreme) valuations are on their way to even higher levels. Just as the tech mania pushed investors to pour money into an over-valued market, one could make the case that the Federal Reserve’s actions have pushed investors to chase yield from dividend-paying companies. Consider a recent manifestation of this: the investment company Vanguard Group recently closed one of their dividend-focused equity funds to new investors (see personal.vanguard.com/us/insights/article/fund-announcement-072016). Such a phenomenon of investors pushing money into dividend-paying equities would cause already high valuations to further increase.
Again, this study showed that CAPE ratios above 18.6 averaged superior nominal investment returns of 0.45 percent when using DCA. However, were advisers reluctant to implement a DCA strategy unless given more robust results, advisers could delay implementing a DCA strategy until market valuations reach a point where the research has shown DCA to outperform LSI 100 percent of time: at valuations above 31, as measured by the CAPE ratio.
Advisers looking to further validate the employment of DCA may examine an additional valuation metric: the five-year normalized P/E ratio. Solow et al. 2011 titled hypothetical portfolios toward fixed-income when the five-year normalized P/E ratio was in its highest decile. This study found success in employing DCA when CAPE ratio valuations were roughly in their highest tercile. In addition to considering the five-year normalized P/E ratio, advisers may also consider the conventional P/E ratio.
This study examined the efficacy of a DCA strategy over 180 consecutive months (15 years), with 1/180 (0.55 percent) of an available investment pool being moved monthly from Treasury bills into the S&P 500. A DCA strategy could be appropriate when investing proceeds from an inheritance, lump-sum pension distribution, or illiquid investment (i.e., hard real estate) liquidation.
As of this writing in September 2016, the CAPE ratio was 26.5. Since that CAPE ratio of 26.5 is well above both the historic average (~16) and the one-third of the time that DCA has shown to generate superior wealth (CAPE ratio above 18.6), this may suggest that DCA could be utilized for investors seeking higher nominal returns over a long period. Given such a highly valued environment, valuation should normalize—generating greater wealth for those who put a DCA strategy in place now. Another word of caution: while valuations are well above average (~16), they are not extreme (31+).
Suggestions for Future Research
This study explored the nominal investment return offered by two strategies for investing in the market. Further analysis could include the impact of loads, commissions, and taxes. Taxes would be manifest from capital gain distributions as well as income on cash and dividends. Additional time periods and strategies could also be explored. And other valuation metrics could be explored, such as the five-year normalized P/E (as per Solow et al. 2011), and the conventional one-year P/E ratio.
Lastly, analysis beyond 1950 could be performed. Recall Figure 5. Particularly relevant is the time period of the market crash (and high valuations preceding it) of 1929. Investigation of this period, being the second-highest peak in market valuations, would be interesting and valuable in order to corroborate and extend the findings of this research.
References
Atra, Robert J., and Thomas L. Mann. 2001. “Dollar-Cost Averaging and Seasonality: Some International Evidence.” Journal of Financial Planning 14 (7): 98–105.
Damodaran, Aswath. 2016. “Annual Returns on Stock, T. Bonds and T. Bills: 1928–Current.” An online compilation found at: pages.stern.nyu.edu/~adamodar/New_Home_Page/datafile/histretSP.html.
Dubil, Robert. 2005. “Lifetime Dollar-Cost Averaging: Forget Cost Savings, Think Risk Reduction.” Journal of Financial Planning 18 (10): 86–90.
Greenhut, John G. 2006. “Mathematical Illusion: Why Dollar-Cost Averaging Does Not Work.” The Journal of Financial Planning. 19 (10) 76–83.
Kitces, Michael. 2016. “Dollar Cost Averaging May Help to Manage Risk but on Average It Just Reduces Returns.” March 2016. Available at: kitces.com/blog/dollar-cost-averaging-versus-lump-sum-how-dca-investing-can-manage-risk-but-on-average-reduces-returns.
Leggio, Karyl B., and Donald Lien. 2003. “Comparing Alternative Investment Strategies Using Risk-Adjusted Performance Measures.” Journal of Financial Planning 16 (1): 82–86.
Markowitz, Harry. 1952. “Portfolio Selection.” The Journal of Finance 7 (1): 77–91.
Shiller, Robert J. 2000. Irrational Exuberance. Princeton, N.J.: Princeton University Press.
Shtekhman, Anatoly, Christos Tasopoulos, and Brian Wimmer. 2012. “Dollar-Cost Averaging Just Means Taking Risk Later.” A Vanguard research paper available at: pressroom.vanguard.com/nonindexed/7.23.2012_Dollar-cost_Averaging.pdf.
Solow, Kenneth, Michael Kitces, and Sauro Locatelli. 2011. “Improving Risk-Adjusted Returns Using Market-Valuation-Based Tactical Asset Allocation Strategies.” Journal of Financial Planning 24 (12): 48–59, 68.
Statman, Meir. 1995. “A Behavioral Framework for Dollar-Cost Averaging.” Journal of Portfolio Management 22 (1): 70–78.
Wilcox, Stephen E. 2011. “A Cautionary Note About Robert Shiller’s CAPE.” CFA Digest 42 (1): 38–39.
Williams, Richard E., and Peter W. Bacon. 1993. “Lump Sum Beats Dollar-Cost Averaging.” Journal of Financial Planning 6 (2): 64–67.
Citation
Luskin, Jon. M. 2017. “Dollar-Cost Averaging Using the CAPE Ratio: An Identifiable Trend Influencing Outperformance.” Journal of Financial Planning 30 (1): 54–60.