Journal of Financial Planning: January 2014
Robert J. Atra, Ph.D., CFA, is professor and chair of the Department of Finance at the College of Business at Lewis University in Romeoville, Illinois. He has published papers on investment strategies and equity returns and is co-author of three chapters in The Valuation Handbook. Send an email to Robert Atra.
Yuntaek Pae, Ph.D., CFA, is assistant professor in the Department of Finance at the College of Business at Lewis University in Romeoville, Illinois. Prior to working in academia, Pae was employed as an equity analyst. Send an email to Yuntaek Pae.
Executive Summary
- New IRS rules on accounting for cost basis impose a decision regarding cost basis when selling shares.
- This introductory study reviews the likely benefits from choosing the highest-in, first-out (HIFO) method for tracking shares when liquidating portfolio assets.
- Results show that for realistic scenarios where investors plan for retirement, HIFO accounting can add between 0.5 percent and 1.0 percent to the investor’s total wealth at the retirement date under typical tax rates.
- Above-average tax rates and greater returns increase the possible value of using HIFO accounting. Similarly, portfolios that are not completely liquidated, such as those that receive a stepped up basis in an estate, may also have greater HIFO benefits but not likely greater than 2 percent of the value of the portfolio.
Researchers often develop financial theory in a world of no transaction costs and taxes. The “frictionless” environment in which the theory is developed can lead to elegant and useful formulas for practitioners. However, an increasing amount of research places emphasis on generating empirical results in light of frictions, primarily taxes. Indeed, for individual investors and many institutional investors, taxes greatly drive investment decision making.
Recent rules from the Internal Revenue Service (IRS) regarding basis tracking buttress this point. The rules, phased in between 2011 and 2013, require securities firms to track the basis of shares being sold. For example, a mutual fund investor who is liquidating shares from a taxable account must choose which cost basis method to use. Frequently, funds give choices of average cost, first-in, first-out (FIFO), specific identification, or highest-in, first out (HIFO). The situation is complicated by the fact that funds often have a default option. Vanguard, for example, uses average cost as the default, as do other fund families, although others may use FIFO (Benz 2012). Because it is generally in the investor’s best interest to sell high basis shares first, neither average cost nor FIFO are likely to be optimal choices for maximizing wealth.
The following equations help elucidate the role of basis. Equation 1 shows after-tax proceeds from liquidating an investment. After rearranging, Equation 2 demonstrates the role of basis as a tax shelter; the higher the BL, the greater the after-tax proceeds, all else equal.
Equation 1: ATP = PL – (PL –BL)(T)
where,
ATP = after-tax proceeds from sale
PL = price of the stock being liquidated
BL = basis of stock being liquidated
T = tax rate
Equation 2: ATP = PL(1-T) + BLT
Investors attempting to maximize after-tax proceeds naturally will try to sell the investment with the highest basis from a lot of otherwise identical investments. Of course, selling the highest basis investment (HIFO accounting) will result in layers of low basis securities for future sales. Hence, tracking securities’ bases can boil down to a time value of money problem, where the benefits from HIFO accounting come from receiving tax benefits sooner rather than later.1
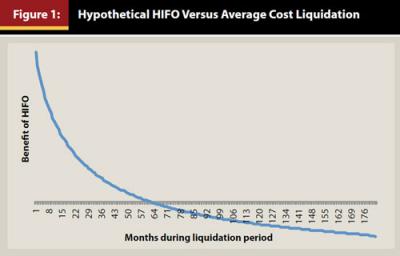
Figure 1 presents the concepts described graphically. In the figure, the horizontal line represents the average cost basis of shares, which remain constant over the liquidation period. The HIFO bases, however, decline as shares are liquidated and eventually are less than the average cost. This occurs in the figure at around month 60. If the account is completely liquidated, both accounting systems (HIFO and average cost) have the same total cost of shares. If the benefits are discounted to determine their present value, HIFO will be superior because the tax shelters from HIFO will have a greater present value.
The purpose of this paper is to provide an overview of the likely benefits associated with choosing the highest-in, first-out (HIFO) method for tracking shares when liquidating portfolio assets.
Previous Tax Basis Literature
Tax issues have gained the attention of financial researchers over the past couple of decades. Dickson and Shoven (1993) were among the first to suggest ranking mutual funds on an after-tax basis. Work by Jeffrey and Arnott (1993) and Arnott, Berkin, and Ye (2001) investigated ways to improve performance through tax management. Perhaps most directly related to this study is Berkin and Ye (2003), who investigated the benefits of loss harvesting and HIFO accounting by demonstrating a cumulative alpha on a simulated portfolio. The tax loss harvesting technique they examined involved an active management process where portfolio managers would sell shares when the share price dropped below the basis value. Their work demonstrated that tax management led to superior returns over a multitude of scenarios that varied tax rates, risk, contributions, and time.
More recently, Horan and Adler (2009) researched the extent to which investment advisers make tax-aware recommendations. Their survey confirmed the use of HIFO accounting by wealth managers. Others have investigated the benefit of HIFO as influenced by different investment strategies. For example, Atra and Mann (2011) showed the benefits of HIFO accounting in comparing lump sum versus dollar cost averaging investment strategies. Their results indicated the value of HIFO accounting is positively related to the number of investment purchases and has a small impact on total wealth.
Methodology
Like Berkin and Ye (2003), a Monte Carlo approach was used in this study to simulate investment scenarios. The program generated 10,000 simulations for each of three hypothetical investments to determine the effects of HIFO accounting. Additionally, risk and tax rates were varied to determine the robustness of the results.
Unlike Berkin and Ye (2003), HIFO accounting was analyzed through a hypothetical retirement planning problem, whereby investments were assumed to be made for a period of 30 years followed by a liquidation period of 15 years as in Atra and Mann (2011). The hypothetical retirement planning problem has several benefits in terms of presentation, compared to previously published papers. First, the simplicity of the two distinct periods is easy to interpret for most investors because each represents typical time frames for those interested in retirement planning. Second, the lengths of the periods also provide evidence to whether or not HIFO accounting has long-term benefits rather than those that disappear over shorter time periods.
Additionally, the use of the capital asset pricing model or other asset pricing models is not needed in the hypothetical retirement problem because the analysis is not dependent upon the computation of any type of “alpha” as in Berkin and Ye (2003). Therefore, the analysis here avoids any criticisms of asset pricing models that are so prevalent in the finance literature.2 Ultimately, the approach used in this study emphasizes the economic significance of a strategy as opposed to statistical significance often emphasized in other academic works.
In the representative retirement problem presented here, investments were assumed to be made into an account at the beginning of each month for 30 years. To make the approach more realistic, the cash flows were not fixed but increased at a money market rate, which should approximate a fixed, real cash flow being invested. Keeping the investment cash flow increasing at a money market rate allows for more realistic interpretations of the dollar amounts as investors will likely deposit increasing amounts as their income increases. A nominal investment of $1,000 per year, or approximately $83 per month, to start was chosen, allowing the results to be easily scaled up or down. The investment account was assumed to accumulate at a randomly generated nominal return based upon parameters discussed later.
It was initially assumed that the retirement account was completely liquidated over a period of 15 years through beginning-of-the-month withdrawals. As in Atra and Mann (2011), the retirement account was exhausted by liquidating an amount from the account proportional to the time remaining. For example, in the first month 1/180 was liquidated. The amount liquidated for each month was 1/(months remaining) until the account balance reached zero at the end of month 180. The notion of completely liquidating the accounts allowed for a fair comparison of the HIFO and average cost accounting techniques because the total value of shares sold under each technique was identical. As discussed later, the assumption of complete liquidation was relaxed in additional analyses.
To test the value of HIFO accounting, cost bases were tracked during the investment period. Given the monthly periodic investment, there were 360 different bases that were generated in the representative retirement problem. Upon reaching the liquidation stage, sufficient shares were sold to fund the liquidation, where the number of shares sold was a function of the market level at the month of liquidation and the number of months left. The shares chosen were based upon the HIFO structure, where sufficient shares were pulled out of each of the 360 cost basis “buckets” to fund the liquidation. The function of the basis was to shelter taxes as in Equation 2, and provide for larger cash flows earlier in the retirement period.
The HIFO accounting system was tested for its relative value against a simple alternative. The choice was made to compare HIFO to an average cost system, where shares that are liquidated have a uniform cost from the investment period computed as the total investment divided by number of shares purchased. The primary advantage of average cost is simplicity, as share basis upon purchase does not have to be tracked. Therefore, the model represents a good, naïve approach for an unsophisticated investor. The naïve approach is justified on the grounds that some investors may not have the belief that the additional complexity of HIFO is worth the effort. In that sense, this study borrows a concept from behavioral finance where investors may “satisfice” as oppose to optimize decision making. And, as stated earlier, it may be the default for some investment companies if investors do not intentionally select a different method.
Because one accounting strategy was being compared to another, transaction costs were ignored that would be similar under either strategy. Other costs, such as taxes incurred on a fund investment, would be the same for HIFO and average cost strategies during the investment period and not likely to change the results of the comparison.
Once the after-tax cash flow was computed for both the HIFO and average cost systems, the difference was taken on a periodic basis. At this point, the differences in after-tax cash flows between the HIFO and average cost accounting systems was strictly a function of share accounting, with the higher basis shares providing more shelter. The 180 differences were then discounted back to the time at which the liquidation period began (that is, the retirement date). The benefit of the HIFO accounting system was represented as a percentage of total value as of that date.
Data
To compare the accounting systems, return data were generated for a hypothetical investment through Monte Carlo simulation for the investment and liquidation periods by specifying means and standard deviations. For simplicity, total returns indices were used and all returns were assumed to be in the form of capital gains.
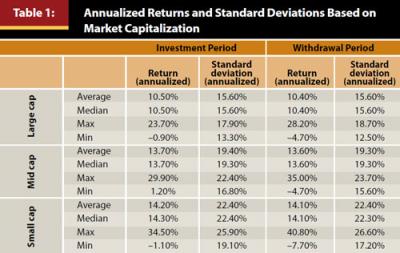
Monthly returns and standard deviations were estimated based upon three historical series from the Fama/French data library.3 The series are ranked by market value with the top 30 percent representing large-cap, the middle 40 percent representing mid-cap, and the bottom 30 percent representing small-cap stocks. The three different historical series provide a convenient way to compare the HIFO benefit under different risk and return scenarios while still retaining the intuition behind the hypothetical retirement problem. For example, the small-cap stock series will have higher volatility, which may lead to a greater HIFO benefit, as discussed later.
Based on historical parameters of those series, and assuming a normal distribution, 10,000 simulations were run in an attempt to track the comparative benefit of the HIFO system against the average basis. Furthermore, to demonstrate the effect of different tax rates in retirement, the relative benefits of the HIFO system were computed for five different tax rates: 20 percent to 40 percent in 5-percent increments. The range of tax rates allows a type of stress test to see how high rates would have to be to make HIFO an economically beneficial strategy. Furthermore, though the low end of the range is more representative of capital gains rates in the past, the high end of the tax rates allows the analysis to be used in future unknown tax environments.
Empirical Results
Empirical results for returns and standard deviations appear in Table 1. As expected, large-cap stocks had the lowest average return and standard deviation, while small-cap stocks provided the highest average return and standard deviation. Exactly what impact the differences in risk and return have on the benefits of the HIFO strategy are discussed below.
The benefit of HIFO is best analyzed as a comparative advantage. Because the alternative to the HIFO strategy is to use an average basis, the benefits of the HIFO strategy can be presented as the value in excess of what would have been achieved with using average basis to generate tax shelters. To put the benefit in perspective, the net present value of the excess was computed at 5 percent to the date of retirement. This was divided by the value of the retirement account as of that date.4 The percentage represents the extra wealth that could be created by pursuing a HIFO strategy when the stocks are liquidated.
The results from the tax benefit analysis appear in Tables 2 and 3. Table 2 presents the dollar values obtained by investing in each of the stock categories, as well as the dollar benefit of the HIFO strategy compared to the average cost strategy as of the day of retirement assuming different tax rates in the liquidation period. The values of the retirement account varied greatly, owing to the higher returns on the mid- and small-cap investments. As a result, the average benefits from HIFO accounting ranged from $1,358 at a 20 percent tax rate, to $2,716 at a 40 percent tax rate on an average portfolio value of approximately $240,000 for large-cap stocks. The dollar benefits were much larger for the mid- and small-cap stocks, owing to their higher return and larger portfolio values. On average, benefits from the HIFO accounting range from approximately $2,000 at the 20 percent tax rate for small- and mid-cap stocks, to as high as approximately $4,868 for the average small stock portfolio taxed at 40 percent.
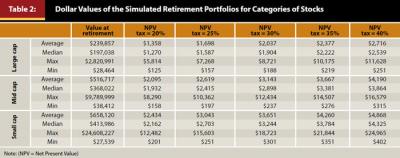
The dollar figures may appear surprisingly low given the attention paid to HIFO accounting. For each $250,000 in a large-cap portfolio at retirement, the present value of HIFO benefits is likely less than $1,500 at a 20 percent tax rate.
Although it is clear that the benefit of HIFO is directly related to the dollar amounts in the retirement accounts, it also is the case that HIFO should be related to volatility because more volatile investments have a wider range of bases from which to run the HIFO accounting. For example, more volatile stocks, such as small-cap equities, may have a greater HIFO benefit relative to large-cap stocks because investors have likely accumulated stocks at highly varied prices during the investment stage. On the other hand, the larger dollar amount accumulated through small stocks increases the dollar value of the HIFO benefit as well.
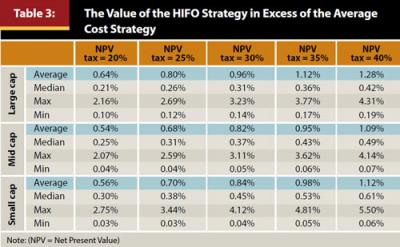
To help sort through the significance of those issues, the relative HIFO benefit as a percentage of the portfolio value is presented in Table 3.5 As can be seen by varying the tax rates, the average benefit of using HIFO, as opposed to average cost accounting, ranges from approximately 0.5 percent to 1.3 percent of the value of the portfolio at the start of the liquidation period, with the benefit being fairly consistent across the investment categories. The large-cap investment—despite having lower dollar value for HIFO benefit—actually has the highest relative benefit of the three investment categories. Even at high tax rates in retirement, which is a scenario that would not likely occur for most investors, the HIFO benefit seems relatively small for all categories as a percentage of the portfolio value. To put this in perspective, for the average investor with a retirement portfolio of $1 million, the benefit from using HIFO accounting as of the date of retirement would likely be less than $10,000.
Results also suggest the large dollar value of the HIFO benefit in the small stock account can be attributed to the dollar amounts accumulated as opposed to the volatility of the returns. When computed as a percentage of the portfolio, the highly volatile small-cap stocks have approximately the same benefit as mid-cap stocks and a smaller HIFO benefit than the large-cap stocks. As illustrated in Table 3, volatility does not drive the HIFO benefit, given historical returns between general stock categories.
One argument in favor of HIFO accounting, despite the empirical results, is that the method always provides a superior outcome. No matter how small the HIFO benefit becomes, Tables 2 and 3 indicate that it never is negative. Put another way, HIFO accounting dominates average cost accounting as a strategy.
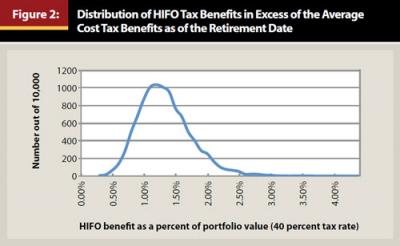
Figure 2 demonstrates the distribution of the benefits from the large-cap simulation for the case where the tax rate of 40 percent in the liquidation period. Other distributions were similar. The figure is revealing in that it shows a skew to the right, with a maximum benefit of more than 4 percent of the retirement portfolio. More importantly, the benefit is bounded on the left hand side at approximately zero. In other words, one of the primary advantages of HIFO accounting is that it has no downside risk; that is, the benefits are always positive when compared to average cost.
The discussion thus far has been based upon the assumption that the accounts were completely exhausted through the retirement period. In fact, such complete liquidation would likely be rare, as most investors would typically leave non-liquidated shares in an estate. The effect of leaving non-liquidated shares in an account is that the timeline presented in Figure 1 is truncated at the right. If, for example, an investor passed away at month 64 in Figure 1, all of the benefits of HIFO accounting would be realized without any of the detriment of future low basis shares liquidated.
According to U.S. tax law, shares of stock in the estate would receive a step-up in basis to current market value at the time they pass to heirs. The consequence of the step-up in basis is that HIFO and average cost are equalized at that point, as any remaining shares no longer carry the bases tracked according to the two competing accounting methods. Clearly, the step-up in basis would benefit HIFO, because the tax benefits occur earlier with the HIFO strategy. A complete liquidation of the account, in that sense, is a worst-case scenario from a HIFO perspective.
To demonstrate the effect of a shortened liquidation period, the present value of the benefits for varying time frames was computed. Results are presented as graphs of both dollar values and percentage of portfolio values. Figure 3 shows the net present value (NPV) profile for large-cap stocks for horizons of 0 to 180 months at a tax rate of 20 percent. Other NPV profiles have a similar shape. The inverted “U” shape of the graph is fairly intuitive. If an investor passes away as of the date of retirement, the net benefit of HIFO is zero as all bases are immediately stepped up, resulting in no difference between the accounting strategies. If the investor lives longer, the benefit of HIFO would be realized and would increase to the point where HIFO shares had a lower basis than average cost. Beyond that point, the HIFO benefit begins to diminish as lower basis HIFO shares are liquidated.

In terms of a dollar amount, the maximum benefit from the HIFO strategy is approximately $5,000 at 60 months and gradually decreases to less than $2,000. Tax rates can be scaled linearly, so the benefit at a 40 percent tax rate would be double at about $10,000. HIFO does have a distinct advantage with the shortened time frame.
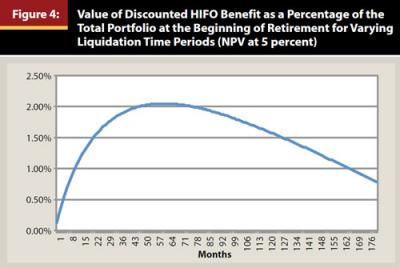
To put all of this in relative terms, the HIFO benefit, as a percentage of ending portfolio values, is presented in Figure 4. Peaking at slightly more than 2 percent around month 60, the shortened time frame increases the benefit as a percentage of the portfolio value to over three times that of the average of 0.64 percent in Table 3. At very high tax rates of 40 percent, the results indicate the HIFO benefit could reach as high as 4 percent of the portfolio value, although a 40 percent tax rate in retirement is not likely.
Using mortality tables, it is possible to estimate the likely benefit from HIFO if the accounts, using the graphs in Figures 3 and 4, are not completely liquidated. Assume, for example, an individual retires at age 68 and begins to liquidate an account as described previously. According to the Centers for Disease Control and Prevention (CDC), males between age 68 and 69 have a life expectancy of approximately 15 years.6 In that case, shortening of the liquidation period is not likely, on average, and the HIFO benefit will be diminished. Females would experience an even longer life and similar results. To receive the increase in HIFO benefits presented in Figures 3 and 4, investors would likely have to live a shorter than average life.
Conclusion and Suggestions for Future Research
This research focuses on decisions taxable investors currently face; namely, what is the economic effect of choosing an optimal basis tracking strategy such as HIFO versus a “sufficing” strategy, such as using the average cost basis? The HIFO strategy was found to have no downside risk but, on average, to provide a small benefit of approximately 0.5 percent to 1.0 percent of the value of a retirement portfolio, with the percentage fairly consistent across large-, mid-, and small-cap stocks.
The value of the HIFO benefit could be much larger if complete liquidation of the portfolios does not occur. This would be the situation with the death of an investor and a resulting step-up in basis on investment assets. In these cases, the benefit, as a percentage of the portfolio, may reach as high as 2 percent under normal tax rates. Based on average life expectancy, however, the increase in HIFO benefit would likely only occur in the event of the investor having a shorter than average life.
More research will likely shed additional light on this very practical topic. For example, how does volatility of returns in the investment and retirement period affect the HIFO benefit, all else equal? Additionally, how does reinvestment of dividends affect the relative benefit of HIFO? Finally, what impact will changing tax rates have on the basis decision-making process? Answers to these questions will provide financial planners and individual investors with additional concrete data on which to guide their after-tax financial decisions. Although this study is an introduction to the topic, the results provide some initial guidance as to the likely benefits of a share accounting strategy such as HIFO.
Endnotes
- More complicated scenarios exist where a simple time value of money analysis will result in incomplete results. For example, if an investor faces increasing tax rates, it is possible that selling low-basis stock sooner might be optimal.
- The active tax loss harvesting technique was not analyzed, because the focus is on simple choices made by an individual investor as opposed to viewing the problem from a portfolio manager’s perspective. Although using tax loss harvesting may increase the benefit of tax management, some investors may prefer a simpler “piggy bank” approach where retirement funds are placed in an account and not touched until needed at liquidation. Furthermore, the structure of the retirement problem in this study only requires that tax planning begin at the date of liquidation and not over the entire investment period, which may be representative of investors who seek guidance only when nearing retirement.
- Data: http://mba.tuck.dartmouth.edu/pages/faculty/ken.french/Data_Library/det_port_form_sz.html.
- A case can be made for various discount rates. Because this paper’s main concern is providing investors with a tool to analyze the benefit of the HIFO strategy, an arbitrary discount rate was chosen. Several discount rates were analyzed. The benefits were similar.
- The numbers presented in Tables 2 and 3 were computed slightly differently. Table 2 presents averages of all the runs of the simulation, while Table 3 was computed by taking each simulation and computing the NPV as a percent of the ending wealth. From there the average was taken and reported.
- Source: www.cdc.gov/nchs/fastats/lifexpec.htm.
References
Arnott, Robert D., Andrew Berkin, and Jia Ye. 2001. “The Management and Mismanagement of Taxable Assets.” Journal of Investing 10 (1): 15–21.
Atra, Robert J., and Thomas L. Mann. 2011. “Can Taxes Save Dollar Cost Averaging?” Journal of Financial Planning 24 (6): 52–59.
Benz, Christine. 2012. “Beware the Default Method for Cost-Basis Elections.” Morningstar. news.morningstar.com/articlenet/article.aspx?id=541811.
Berkin, Andrew, and Jia Ye. 2003. “Tax Management, Loss Harvesting, and HIFO Accounting.” Financial Analysts Journal 59 (4): 91–102.
Dickson, Joel M., and John B. Shoven, 1993. “Ranking Mutual Funds on an After-Tax Basis.” NBER Working Paper No. 4393. National Bureau of Economic Research. www.nber.org/papers/w4393.
Horan, Stephen M., and David Adler. 2009. “Tax-Aware Investment Management Practice.” Journal of Wealth Management 12 (2): 71–88.
Jeffrey, Robert H., and Robert Arnott. 1993. “Is Your Alpha Big Enough to Cover Its Taxes?” Journal of Portfolio Management 19 (3): 15–25.
Citation
Atra, Robert J., and Yuntaek Pae. 2014. “Likely Benefits from HIFO Accounting.” Journal of Financial Planning 27 (1): 54–60.