Journal of Financial Planning: August 2011
Steven Dolvin, Ph.D., CFA, a finance professor at Butler University since 2004, teaches primarily in the area of investments and oversees student-run portfolios in both public and private equity. He has published more than 25 articles, with an emphasis in initial public offerings and venture capital.
John Gonas, Ph.D., a finance professor at Belmont University since 1998, primarily teaches corporate finance, investments, economics, and an applied portfolio management course. His research interests include institutional investment management, initial public offering pricing, and the economics of charitable giving.
Executive Summary
- Separately managed accounts (SMAs) generally carry a higher fee structure than standard mutual funds, but managers tout the ability to customize accounts as being worthy of this higher cost. This customization may increase returns, or it may simply allow for more personalized tax management or control over other unique circumstances.
- Very little research exists on the relative return benefit of SMAs compared with actively managed mutual funds. We fill this gap by examining firms that offer concurrently managed funds—SMAs as well as matching mutual funds run by the same manager(s) and following the same general strategy.
- We find that large-cap SMAs provide no significant improvement in performance compared with the mutual funds concurrently offered by these managers.
- In contrast, we find that there does appear to be a positive relative return (at least on average) for small-cap SMAs compared with their mutual fund counterparts.
- We also document that the SMAs (particularly small cap) most likely to outperform mutual funds are those offered by older firms and those that have experienced larger SMA asset growth through returns; those with large net inflows from new accounts tend to underperform.
- Although customization may be necessary for some, for most investors an “off the rack” approach offered by mutual funds may be the simplest tactic.
As consumers, we must often choose between a mass-produced item and one that is more customized. For example, a gentleman looking to buy a suit could visit the shopping mall and select from a number of “off the rack” garments or visit Savile Row, a London street famous for its high-quality custom tailors. As you might expect, the price difference is quite large.
As with suits, investors—and financial advisers—have the choice between a mass-market product (such as a mutual fund) and a more customized approach (like a separately managed account [SMA]). The customized approach is typically more costly; however, it allows for customization in tax planning, investment holdings, and other key elements. Although this trade-off is usually accepted, the more debatable issue is whether this customization produces a higher return (is a higher-quality product).
Because customized portfolio management is costly, most brokerage firms traditionally maintained minimum account sizes of $1 million to $5 million. Yet competition in the investment advisory industry and technological advances in information management have resulted in a dramatic decline in SMA fees and minimum asset amounts. For example, brokerage firms now offer SMA services to investors with as little as $50,000, and average SMA fees declined from 2.03 percent in 2000 to 1.65 percent in 2005.1
However, growth in SMA popularity resulting from the decline in minimum account sizes, management costs, and trading fees has also had an adverse effect on investment advisory firms’ ability (or willingness) to customize portfolios to investor-specific objectives. For example, in exchange for an advisory firm’s willingness to manage SMA portfolios with minimum account sizes as low as $50,000, investors are often restricted to target allocations consistent across all portfolios under the firm’s management.
The historical growth in the popularity of SMA accounts and the technological changes that allow an advisory firm to manage smaller account sizes motivate the two specific research questions addressed in this paper: (1) Do SMAs offer higher returns than traditional actively managed mutual funds concurrently managed by the same firm? and (2) Are differences in SMA and mutual fund performance related to an advisory firm’s ability to offer customized SMA portfolio management?
To answer these questions we analyze returns of domestic equity SMAs and mutual funds (MFs). In addition, we focus on a sub-set of SMAs and MFs concurrently managed within the same advisory firm. By examining the performance of concurrently managed accounts, we directly test whether SMAs outperform MFs, holding the effects of the asset manager constant. Our initial findings suggest that the returns of large-cap SMAs and MFs are virtually the same; there is no return (or quality) benefit from choosing a customized approach. Thus, investors (or their financial advisers) may only wish to follow a customized route if specific tax-planning or similar issues are of critical importance. In contrast, we find that the returns of small-cap SMAs are significantly higher, on average, than the returns from MFs. Thus, paying for customization at the small-cap level may bring multiple benefits.
Although small-cap SMAs usually outperform MFs, this result is not consistent across all firms. Thus, we also examine which firm characteristics tend to be associated with increased performance. We find that older firms tend to provide a greater return from customization, as do those experiencing a greater increase in relative assets under management (where SMA assets are growing faster than MF assets). However, we find that an increase in net inflow reduces return, suggesting that growth through return is more favorable than asset growth from new accounts, as an increased number of accounts may prevent managers from offering the same level of customization (and associated benefits).
Differences Between Managed Accounts and Open-Ended Mutual Funds
Although some confusion exists in the investment consulting industry as to what actually constitutes a managed account, the industry generally classifies accounts into five program types, with the primary differences being who actually manages the portfolio, the types of investment products held in the portfolio, and the degree of customization available to an investor. These product types include open-ended actively managed mutual funds, fee-plus-commission SMA accounts, fee-only (wrap) SMA accounts, fee-only mutual fund (wrap) accounts, and broker-managed discretionary fee-only accounts. Of relevance to this study, consultant separately managed account programs (the traditional SMA) include all discretionary portfolios managed by unaffiliated investment advisers for investors whose assets are held in custody at a broker-dealer.
An SMA typically has two different cost structures. First, an investor can have a fee-plus-commission arrangement in which the asset manager collects a percentage of assets under management (usually paid quarterly) and the broker-dealer receives a per-trade commission. Alternatively, under an all-inclusive wrap-fee arrangement, the investor pays for asset management and broker-dealer fees simultaneously. The wrap-fee arrangement is most commonly used with retail-oriented brokerage accounts, and the fee-plus-commission arrangement is primarily used with relatively larger institutional SMAs (minimum portfolio size of $5 million to $10 million).
In the 1970s and 1980s, because of the higher transaction costs associated with these accounts, fee-based individually managed accounts were only accessible to institutions, pension plans, and high net-worth individuals. However, the development of new technology and trading software in the early to mid-1990s allowed professional asset managers to individually manage fee-based portfolios in a fraction of the time and at significantly reduced costs. For example, the development of specialized software now allows brokerage firms to disseminate a large trade among hundreds of accounts with no manual bookkeeping.
One of the more obvious differences in MFs and SMAs is that a traditional open-ended MF offers shareholders a percentage ownership or stake in a co-mingled pooled account, whereas an SMA provides ownership of securities in custody at a broker-dealer. As a result, the MF is commonly perceived as more restrictive, given that investors cannot specifically request particular trading guidelines. Conversely, SMAs offer investors greater control over account management, particularly the ability to restrict the manager’s trading activity. The ability to set trading parameters can be important for investors sensitive to incurring realized capital gains and losses.
Although MF managers may adhere to a tax-sensitive trading discipline in terms of incurring realized capital gains, they cannot meet specific capital gains restrictions for individual shareholders. Furthermore, new shareholders can inherit embedded capital gains realized prior to purchase.2 In contrast, most SMAs claim to offer asset management guidelines that include client-specific tax-planning strategies. For example, if a client wishes to withhold a particular security from sale, the SMA asset manager can set aside that position.
The last important difference between MFs and SMAs is the number of positions usually held. A typical equity MF will hold in excess of 75 common or preferred stocks, whereas a typical SMA will hold between 40 and 60 positions. Even MFs concurrently managed with SMA accounts will commonly hold two to three times as many positions as their SMA counterparts, diversifying among and within more sectors and industry groups.
Prior Research and Beyond
Portfolio customization and investor characteristics aside, prior research suggests that actively managed SMAs can achieve superior performance over co-mingled, open-ended MFs. For example, Padgette (1998) finds that large-cap, domestic equity SMA portfolios outperformed similar open-ended retail MFs from 1988 to 1997. However, Padgette only compares gross returns, and thus his analysis does not control for the higher fees (trading, management, and administrative costs) charged to SMA investors. In this study, we compare net SMA returns to net MF returns, adjusting for management and trading costs.
Moreover, prior studies primarily examine SMAs as a whole versus MFs as a whole. Although this approach provides some insight, it does not allow for a more concrete comparison of SMAs and MFs. Thus, we concentrate on investment managers that concurrently offer both MFs and SMAs, particularly those identified as having the same basic strategy, personnel, and investment approach. This specific comparison allows us to effectively control for differential management and determine whether any structural differences exist between SMAs and MFs that would affect investment performance.
Advances in technology in the early to mid-1990s enabled advisory firms to concurrently manage SMA portfolios and MFs without losing efficiencies associated with trading and asset allocation. By comparing each product within an advisory firm, we target portfolio and firm characteristics that can help explain potential disparities in performance. In addition, we test for differences in both large-cap and small-cap products.
We also consider whether actively managed portfolios (SMAs or MFs) offer risk-adjusted abnormal returns. If an adviser’s management of a portfolio adds value beyond the performance of a passively managed market portfolio, she or he will generate positive risk-adjusted abnormal performance. SMA and MF risk-adjusted abnormal returns (alphas) are the intercepts estimated from the following model:
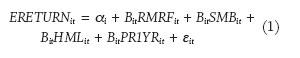
where ERETURN is the quarterly return of an SMA or an MF in excess of the risk-free rate. RMRF is the excess return of the Center for Research and Securities Prices (CRSP) value-weighted market index. SMB, HML, and PR1YR were obtained from Ken French and Mark Carhart and represent factor-mimicking portfolio returns adjusted for size, book-to-market, and momentum, respectively (see Fama and French 1993, and Carhart 1997). This approach allows us to estimate the firm’s alpha (a) to determine whether any excess, risk-adjusted return is being earned.
We also consider whether firm characteristics pertaining to asset growth, reputation, and the decision to accept smaller SMA account sizes can explain performance differences. For example, advisory firms that concentrate on managing relatively larger SMA portfolios (minimum account sizes in excess of $500,000) are assumed to offer greater customization. Conversely, advisory firms that participate in broker-dealer sub-advisory programs, and in exchange are forced to accept account sizes as low as $50,000, are less likely to tailor individual portfolios to a client’s specific investment objectives.
Data and Empirical Methodology
We collected quarterly returns for a sample of 115 pairs of SMA accounts and open-ended mutual funds for the period 1998 to 2003.3 Our data sources are Prima Capital for SMA returns, the CRSP for MF returns, and Morningstar for other MF data. We required that each MF and SMA follow industry reporting standards in order to minimize differences in return calculation methodology, management style categorization, and the treatment of management and brokerage fees. To compare SMA returns with MF returns, we made three adjustments to the individual returns. First, we adjusted SMA returns to reconcile a discrepancy between SMA and MF return calculation methodology. Second, we reconciled differences in how SMAs and MFs define their investment objectives. Third, we reconciled differences in how returns may or may not include specific management or brokerage costs.
SMA returns include quarterly changes in the market values of portfolios within a single SMA product of an investment advisory firm. In calculating returns, advisory firms use their own return calculation method or the return calculation methodology sanctioned by the CFA™ Institute’s Performance Presentation Standards (PPS). To minimize inconsistencies and biases related to differences in SMA return calculation methods, we only include SMA accounts that adhere to PPS and thus best match standard MF return calculation methods.
MFs use a standardized calculation method to capture the change in net asset value (NAV) from one period to the next. In contrast, SMA returns must accommodate cash flows within specific portfolios. Because SMA accounts are conglomerations of individually managed portfolios, calculating their period returns presents two challenges: (1) accounts must be asset-weighted, where portfolio weightings should reflect market values as well as in-period cash flows, and (2) accounts must accommodate time-weighted cash flows, where sub-period returns are computed between cash flows and then geometrically linked.4
To meet these challenges, CFA Institute Performance Presentation Standards suggest a process for calculating a time-weighted composite return. First, each portfolio must accommodate an investor’s cash withdrawals and contributions by computing a weighting factor for each cash flow. Second, the composite’s period return is calculated by capturing the cash-flow-weighted change in the account’s beginning market value. If an advisory firm does not adhere to the PPS calculation standards, its individual portfolio cash flows will have an effect on distorting composite SMA performance. Therefore, in order to create a like SMA-MF comparison, we only compare MF returns to SMA returns in compliance with PPS.
A second inconsistency across the SMA and MF accounts is the difference in the definition of a product’s style or management objective. Advisory firms follow a variety of self-prescribed equity investment disciplines. Although Morningstar is known to categorize many MFs, the investment management objectives of most SMAs follow no standardized categorization. Thus, we match SMA and MF style descriptions by pairing benchmarks self-prescribed by an advisory firm. As a result, our sample only includes domestic equity SMA composites and MFs benchmarked to an identical list of self-proclaimed indices.5
Third, SMAs and MFs have different mechanisms for how investors pay for broker-dealer services and advisory firm asset management. The open-ended MF has an internal management fee (paid quarterly as a percentage of the fund’s market value), trading commissions, and a selling commission (paid at the time of purchase and/or sale for “loaded” funds). Selling commissions only apply to loaded funds sold by third parties (banks, brokerages, etc.), but are tiered based on an investor’s purchase amount. Therefore, larger retail and institutional loaded MFs offer reduced or no selling commissions when an investor’s purchase amount reaches break points.
Conversely, an SMA typically offers investors the opportunity to pay for all broker-dealer and asset management costs with one fee. To reconcile differences between MF multiple fees (internal, commissions, and loads) with the SMA all-inclusive fee structure, we compare SMA returns net of management and trading costs to MF returns net of management and trading costs, but not selling commissions.
Three observations motivated the decision to exclude selling commissions from MF returns: (1) many MFs in our samples are no-load and thus do not carry a selling commission, (2) most loaded MFs in our samples are offered through broker-dealer fee-only programs that enable investors to purchase them at NAV (no load) while paying a separate fee based on assets under management, and (3) most loaded MFs offer reduced loads when a shareholder invests a certain amount within the MF’s fund family. As a result, loaded MFs usually offer a variety of selling commission arrangements based on criteria specific to investor characteristics.
Prior to comparing SMA and MF returns, we also adjusted SMA returns for management and trading costs. Unfortunately, SMA managers do not report management and trading cost information. Thus, we adjusted the SMA returns using the average management fee prevailing in the market based on a survey of five representative broker-dealers. We assumed that competition for assets from sophisticated SMA investors ensures that SMA management fees are roughly consistent with these estimates.6 For example, the average wrap fee on the smallest accounts is 2.4 percent of AUM, and the largest accounts (greater than $5 million) have average wrap fees of 1.1 percent. We note that the range between the maximum and minimum wrap fee declines as account size increases, indicating that competition among broker-dealers is the most intense for large accounts.
We adjusted SMA returns for the average annual wrap fee as follows:

where is the net-of-fee quarterly SMA return for fund i at quarter t, is the average annual SMA wrap fee corresponding to the minimum account size m for fund i, andis the gross-of-fee quarterly SMA return for fund i at quarter t. All analysis is conducted using SMA net-of-fee returns.
Lastly, we excluded from the analysis all funds having names that indicate concentrations in convertible securities, REITs, or sector funds. In addition, we excluded all SMAs or MFs that follow a passive index management style, hold a majority concentration in international securities, or include “all-cap” or “mid-cap” in their names.7
Empirical Results: Comparing Performance
Table 1 reports the summary statistics for the 115 concurrently managed SMA and MF products. We compare SMA and MF return performance and portfolio characteristics. For return, we report the difference between the SMA and MF products offered by the investment managers—for net quarterly return as well as for alphas, as described in Equation 1. For portfolio characteristics, we include the differences in portfolio turnover, average number of positions, cash position, assets under management, and average annual six-year net inflow.8 Turnover and the average number of positions are directly controlled by the investment adviser who has discretion over the management and allocation of the fund’s portfolio. The decision of where to set an SMA’s or MF’s minimum initial investment is directed by the fund’s advisory firm, whereas a fund’s assets under management and annual net inflow are market-driven variables that capture investor sentiment.
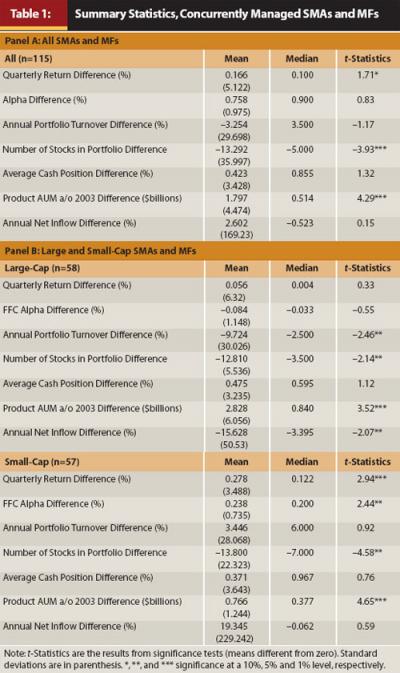
Examining Panel A in Table 1, we find that the quarterly return of SMAs is about 17 basis points higher than that of the comparable set of MFs, and this difference is significant at the 10 percent level. However, examining Panel B reveals that this performance difference is completely driven by small-cap SMAs, as the small-cap SMAs outperform their concurrent MFs by about 28 basis points per quarter. This result is even more pronounced with the alpha difference, as across the entire sample the risk-adjusted return is insignificantly different between SMAs and MFs, whereas the alphas for small-cap SMAs are significantly higher than those of the comparable set of MFs. Thus, it appears that SMAs may provide some performance enhancement, but primarily for small-cap funds.
Continuing the analysis, we find that portfolio turnover is lower in SMA accounts, suggesting that trading is less aggressive; however, this result is primarily confined to large-cap funds. The number of positions held in SMAs is significantly smaller across all fund types, likely as a result, in part, of the diversification requirements imposed on mutual funds. But we find that there is no difference in the amount of cash held, suggesting that allocation strategy may be similar across products. On average, the assets under management within an advisory firm’s SMA portfolios are significantly larger than the assets under management within a firm’s MFs.
The net inflow difference is insignificant across the whole sample; however, there appears to be an offsetting influence in the large-cap and small-cap samples. Specifically, annual net inflow into the large-cap SMAs appears to be lower than the respective mutual funds, but it is higher (though insignificant) for small-cap SMAs compared with their respective mutual funds. This may be a function of the period under review.
Evaluating Risk-Adjusted Performance
Each individual firm’s concurrently managed SMA and MF products were compared to determine whether a significant difference in risk-adjusted returns exists (the model given in Equation 1 was estimated for each SMA/MF pair in the sample).9 Based on the results, we find that only two of the large-cap firms offer SMA products that significantly (at a 5 percent level or greater) outperform their concurrently offered MFs. In fact, we find that there are more firms (three) whose MF returns are significantly higher, suggesting that as a general rule, large-cap customization does not provide an increased return.
The small-cap sample reveals 13 firms with significant abnormal performance, almost a quarter of the sample. In addition, we find that there is no occurrence of the MF product outperforming the SMA. To determine whether this difference is significant for the group as a whole, we estimate the average consolidated alpha, finding that it is significantly different from zero, with a t-statistic of 2.43. Thus, although all small-cap SMAs do not outperform the concurrently offered mutual funds, our evidence suggests that a significant number of them do.
Evaluating Firm Characteristics
In an attempt to help investors and financial advisers determine which firms are most likely to have SMA products that outperform MFs, we extend our analysis by examining underlying firm characteristics. In particular, we focus on the following nine variables:
- D.NETINFLOW, the average annual difference in net inflows between concurrently managed SMAs and MFs
- D.LNAUM, the average annual difference in SMA and MF assets under management
- D.AUMGROWTH, the average annual difference in percentage growth in SMA and MF assets under management from 1998 to 2003
- ACCTGROWTH, the annual average percentage growth in size for all SMAs managed by an investment management firm
- EFGROWTH, the average annual percentage growth in size for all SMAs managed by an investment management firm categorized as either an endowment or foundation
- MORNINGSTAR, the average five-year Morningstar rating for all mutual funds managed by an investment management firm
- AGE, the number of years an investment management firm has been in existence (as of 2003)
- MINIMUM, a binary variable that captures whether an advisory firm’s SMA minimum account size is less than $500,000, zero otherwise
- SUBADV, a binary variable that captures whether an advisory firm manages retail SMA portfolios within a broker-dealer program, zero otherwise
We use these variables in an attempt to capture an advisory firm’s transparency in the marketplace as well as the level of investor monitoring of its funds. Industry experts suggest that greater market visibility is correlated to a greater influx of new capital. As a result, we test whether an advisory firm’s ability or decision to acquire more accounts is related to an inability to customize its SMAs, therefore leading to less of a performance difference between its concurrently managed SMAs and MFs.
It is possible that some of the variables (particularly the final six) are related and, therefore, not capturing unique characteristics. However, we conduct a correlation analysis, finding that there is no significant correlation among any of the variables. In fact, most are at 0.2 or lower, with the one exception being the relationship between account growth and a sub-advisory relationship. Even this, however, is generally below 0.5. The low correlations among the variables indicate that the variables are likely capturing different aspects of the firm.
To examine the relative influence of each variable on firm performance, we regress the differences in abnormal performance on the nine variables identified above. We report the results of this analysis in Table 2. Although our prior results suggest that any significant difference in return is concentrated primarily among small-cap firms, we do find two variables that are significant in all regressions. Specifically, differential growth in assets under management is positively related to outperformance of SMAs versus MFs; however, in contrast, differences in net inflow are negatively related. Therefore, the greater the disparity in an advisory firm’s SMA-MF assets under management, the greater the division in how the two product types are managed.
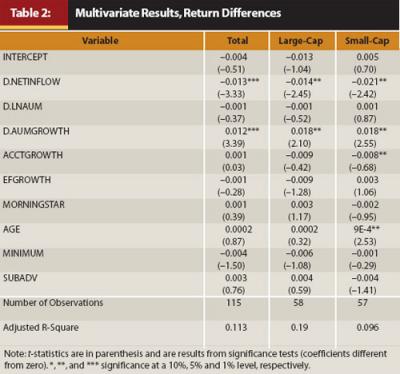
These findings may also suggest that past performance (which would lead to an increase in relative assets under management) is a key factor for financial advisers to focus on, and increased inflow from new investors should raise concern as it likely prevents managers from continuing to implement core strategies and provide the same level of customization. The other significant variable, but only in the small-cap sample, is age. The results suggest that older firms are generally associated with increased performance differences (SMAs are more likely to outperform their MF counterparts).
Conclusion
As with a gentleman choosing between a custom-tailored suit and one off the rack, financial advisers are often faced with the choice of using separately managed accounts or actively managed equity mutual funds. There is little debate that a customized SMA offers the opportunity to manage accounts with taxes (or other issues) in mind. However, there previously existed little evidence as to the return benefit of such customization.
We address this particular issue by focusing on SMAs and MFs offered by the same management firms, thereby allowing us to control for the influence of management. We find no difference in performance for large-cap funds; however, we do find that a significant portion of small-cap SMAs outperform their MF counterparts.
We further examine which firm characteristics are related to this outperformance. Our findings suggest that financial advisers looking for an SMA should focus on those firms that are older, have positive growth in assets under management (particularly SMAs relative to MFs), and have moderate amounts of net new inflow. We surmise that relative growth of assets under management causes firms to place more emphasis on the management of SMAs (because that is where the majority of growth exists); however, increased net inflow into these accounts prevents them from continuing to offer the extent of customization that produced the performance.
As a whole, we believe our results suggest that for most investors, SMAs are like a Savile Row suit—nice to have, but an off-the-rack mutual fund would serve the same purpose. The one exception might be those clients who have unique tax (or related) issues. However, should a customized route be chosen, we believe that greater return benefit is likely achieved on the small-cap side.
Endnotes
- Cerulli Associates.
- For example, assuming a fund pays its capital gains distributions to its shareholders in November, a new shareholder who purchases the fund in October (prior to its ex-dividend date) will fully participate in such a distribution.
- Data availability is restricted to 1998–2003 because of availability of proprietary data as well as limited access to professionals who concurrently manage both SMAs and open-ended MFs.
- CFA Institute Guidance Statement of Calculation Methodology
- We categorize MFs and SMAs as large-cap funds if they track one of the following indices: Russell 1000, Russell 1000 Growth, Russell 1000 Value, S&P 500, S&P 500 Barra Growth, S&P 500 Barra Value, Wilshire Target Top 750, Wilshire Target Large Company Growth, or Wilshire Target Large Company Value. Small-cap funds track one of the following indices: Russell 2000, Russell 2000 Growth, Russell 2000 Value, S&P Small Cap Barra 600, S&P Small Cap 600 Growth, S&P 600 Small Cap Barra Value, Wilshire Target Small Company Growth, or Wilshire Target Small Company Value.
- We conducted separate analysis using the mid-point, minimum, and maximum fee and found that the results are virtually unchanged.
- Parameters used in Ennis and Sebastian (2002) and Del Guercio and Tkac (2002).
- The portfolio turnover, number of positions, and AUM reflect year 2003 only. These characteristics are unavailable for earlier years.
- To conserve space, we have elected not to report the 115 regression results; however, these are available upon request.
References
Carhart, M. 1997. “On the Persistence in Mutual Fund Performance.” Journal of Finance 50: 57–82.
Del Guercio, Diane, and Paula Tkac. 2002. “The Determinants of the Flow of Funds of Managed Portfolios: Mutual Funds Versus Pension Funds.” Journal of Finance and Quantitative Analysis 37: 523–557.
Ennis, Richard, and Michael Sebastian. 2002. “The Small-Cap Alpha Myth: No Evidence That Active Small-Cap Managers Add Value Consistently.” Journal of Portfolio Management 28: 11–17.
Fama, Eugene F., and Kenneth R. French. 1993. “Common Risk Factors in Returns on Stocks and Bonds.” Journal of Financial Economics 33: 3–56.
Money Management Institute. 2010. 2010–2011 Industry Guide to Managed Investment Solutions. 200.
Padgette, Robert. 1998. “Separate Account Manager Versus Mutual Fund Performance.” The Mobius Strip 5: 1, 6–12.