NAIC regulations are insufficient for CFP® practitioners; New York’s “best interest” rule provides better guidance
by Paul H. Auslander, CFP®; V. Raymond Ferrara, CFP®; and Barry D. Flagg, CFP®, CLU®, ChFC®, GFS®
Paul H. Auslander, CFP®, is director of financial planning at ProVise Management Group. He is a former president and chair of the board of directors of FPA. He also served on Florida’s first Financial Literacy Council and is interviewed regularly on CNBC and Bloomberg and quoted frequently in various media.
V. Raymond Ferrara, CFP®, is chair, CEO, and CCO of ProVise Management Group, and has been recognized as one of America’s best financial planners. He served on the board of directors for CFP Board of Standards Inc., the Institute of Certified Financial Planners, National Advisor’s Trust Company, and FPA. He’s been a featured speaker for many organizations, as well as at business conferences throughout the United States.
Barry D. Flagg, CFP®, CLU®, ChFC®, GFS®, is the inventor and founder of Veralytic®, a patented online publisher of life insurance pricing and performance research and product suitability ratings. He’s a recognized expert in applying prudent investor principles to life insurance product selection or retention and portfolio management. He has authored numerous articles and delivered continuing education courses on the management of life insurance as an asset.
JOIN THE DISCUSSION: Discuss this article with fellow FPA Members through FPA's Knowledge Circles.
CFP® professionals are responsible for complying with CFP Board’s new Code of Ethics and Standards of Conduct as of Oct. 1, 2019, with enforcement beginning June 30, 2020. The new practice standards require that CFP® professionals, when providing financial advice to a client, “must act as a fiduciary and, therefore, act in the best interests of the client” (view the full text of the new practice standards at cfp.net/ethics/code-of-ethics-and-standards-of-conduct). The new standards also define “financial advice” as a communication that would “reasonably be viewed as a recommendation that the client take or refrain from taking a particular course of action with respect to … purchasing, holding, gifting, or selling financial assets.”
According to the Financial Accounting Standards Board, financial assets include instruments that convey a contractual right to receive cash. In that life insurance policy contracts include contractual rights to receive a cash death benefit or a cash surrender value, it satisfies the generally accepted definition of a financial asset. As such, CFP® professionals must act in the best interests of the client when advising about purchasing, holding, gifting, or selling life insurance.
In the past, due diligence for life insurance product recommendations had been governed by the National Association of Insurance Commissioners (NAIC) Life Insurance Illustrations Model Regulation #582 (as adopted by each state), which doesn’t require disclosure of any costs. As a result, the NAIC regulation is now considered “misleading,” “fundamentally inappropriate,” and “unreliable” by financial, insurance, and banking industry authorities.1 The New York Department of Financial Services recently issued new recommendations for life insurance and annuity sales that provide better guidance for CFP® professionals who need to adhere to the CFP Board’s new practice standards.
This article provides practical guidance for CFP® professionals who must now comply with the new CFP Board practice standards when making life insurance recommendations.
New York’s Best Interest Rule
Last year, the New York Department of Financial Services (NY DFS) issued an amendment to Regulation 187 that redefines the meaning of acting in the “clients’ best interests” for life insurance product recommendations, effective February 2020.
Regulation 187 prohibits illustration comparisons as due diligence for life insurance product recommendations (the life insurance industry lobbied to expressly include illustration comparisons, but New York rejected this request).2 Instead, it requires product recommendations be based on a careful, skilled, prudent, and diligent evaluation of costs, performance, and risks relative to benefits.
The New York “best interest” rule is significant given the broad efforts to more clearly define clients’ best interests (e.g., the DOL Rule and the SEC Best Interest Rule) and the state of New York’s reputation as being a bellwether state for insurance regulation. Other states are also enacting or considering their own “best interest” rules. For example, Nevada and Connecticut have enacted legislation; Maryland, New Jersey, and Illinois have introduced legislation; and California is working on life insurance regulation to better define clients’ best interests.3
New York’s Regulation 187 defines clients’ best interest in terms of: (a) costs that can be justified, (i.e., cost of insurance charges, mortality and expense fees, investment advisory fees, surrender charge, charges for riders, etc.); (b) performance that is reasonable to expect (i.e., availability of cash value, equity-index features, limitations on interest returns, etc.); and (c) risk that is appropriate for the circumstances (i.e., market risk, guaranteed interest rates, etc.) “based upon all products, services, and transactions available to the producer.”4
Defining clients’ best interests for life insurance product recommendations in terms of costs, performance, and risk is well-established by centuries of debate, legislation, litigation, and case law; and it is consistent with the new CFP Board practice standards.
Regulation 187 also requires that a product recommendation “reflects the care, skill, prudence, and diligence that a prudent person acting in a like capacity and familiar with such matters would use under the circumstances then prevailing.”5 The duty to exercise reasonable care, skill, and caution is also well-established as an essential element of product recommendations in the clients’ best interests, and also a requirement under new CFP Board practice standards, but absent from the NAIC Life Insurance Illustrations Model Regulation.
Why Following NAIC Regulation Can Lead to Breach of Duty
The NAIC Life Insurance Illustrations Model Regulation was promulgated in 1995 with the intent to “ensure that illustrations do not mislead purchasers of life insurance and to make illustrations more understandable.”6 With this goal, it’s plausible that supposed apples-to-apples illustration comparisons would be used as due diligence for product recommendations. However, the NAIC subsequently concluded that, “in the absence of uniform guidance, two illustrations that use the same index and crediting method often illustrated different credited rates.”7
Therefore, let’s examine why comparisons of hypothetical illustrations expose CFP® professionals to breach of their fiduciary duty to act with care, skill, prudence, and diligence.
Consider a 45-year-old, extra-healthy client needing $1 million of permanent life insurance and wanting cash value as an exit strategy in case he no longer needs this coverage. The CFP® professional calls a trusted life insurance agent/broker or the insurance services department at their financial institution, who in turn calls their brokerage general agency (BGA) or insurance marketing organization (IMO) for premium quotes payable for 20 years and calculated using a 5 percent interest rate, so quotes can be compared to determine which product is best for this client.
The CFP® professional receives illustrations for two products: a traditional universal life (UL) product, and an indexed universal life (IUL) product. The products are from two well-known insurers that are both highly rated for financial strength and claims-paying ability. Both illustrations prominently display the requested 5 percent assumed rate of return in column headers immediately above the hypothetical values that were (supposedly) calculated using that rate of return.
The premium for the UL product is about $8,500. The premium for the IUL product is about $13,000. No competition, right? After all, the premium will always be the difference between the sum of all cost of insurance charges (COIs) and expenses (E) less the sum of interest earned (i%) and used to pay internal costs (premiums = COIs + E – i%). If the interest rate used to calculate hypothetical premiums is the same, then the difference in premiums must be attributable to the difference in costs, right?
Let’s take a closer look at excerpts from the actual insurance company illustrations for both products showing actual costs the insurer represents they will charge, as well as the interest presumably calculated at the requested 5 percent assumed interest rate. As you can see in Panel A of Table 1, the UL product charges $30,463 in premium loads, $122,760 in fixed administration expenses (FAEs), and $991,804 for cost of insurance (COI) charges, totaling $1,145,027 through policy year 50.
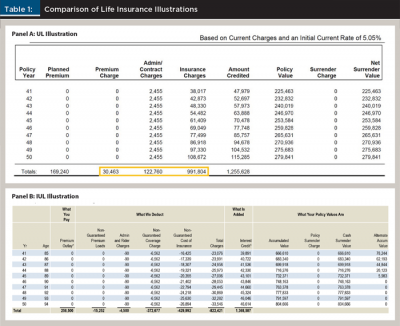
On the other hand, the insurer of the IUL product represents they will charge a total of $822,421 comprised of $15,252 in premium loads, $4,500 in rider charges, $372,677 in fixed administration charges (FAEs), and $429,992 in cost of insurance charges (COIs) also through policy year 50, as shown in Panel B off Table 1.
It is mathematically impossible for a premium calculated using the same assumed rate of return to be lower when policy expenses are greater, unless the amount of assumed interest credited is not as it appears.
So, let’s look more closely at the interest component. Interest credited to a policy in any given year will be calculated starting with the end-of-prior-year policy account value, adding new premium contributions, deducting COIs and policy expenses, and then multiplying that result by the applicable interest rate. For instance, the interest credited on an account of $110,000, plus $0 in premiums, less $9,000 in COIs and expenses, would be a little more than $5,000.
However, the amount shown to be calculated and credited in these UL and IUL products is different than this math suggests. As shown in Panel A of Table 2, the account value of the UL policy is projected to be $110,461 at the end of policy year 25, plus premium contributions of $0, less $9,137 in total policy costs deducted ($0 in premium loads, $2,455 in FAEs, and $6,682 in COIs) equals $101,324. However, the amount of interest shown to be credited is $14,170, which is not 5 percent; it is closer to 14 percent.
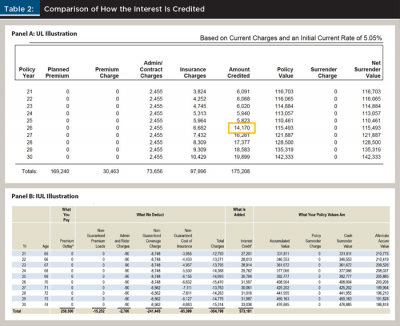
Similarly, Panel B of Table 2 shows the account value of the IUL policy is projected to be $392,777 at the end of policy year 25, plus premium contributions of $0, less $15,470 in total policy costs deducted equals $377,307. Once again, interest of $31,597 shown to be credited on $377,307 is not 5 percent; it is closer to 8 percent. Both illustrations are clearly not apples-to-apples, and instead are downright misleading.
To be clear, this is not to say that either of these insurers cannot actually credit more than 5 percent. For instance, some insurers claim to be able to credit higher interest due to investment strategies that include greater exposure to alternative asset classes, but illustrations don’t consider the greater risk inherent in such asset classes. Other insurers claim to expect cost savings under certain circumstances that they project (but don’t guarantee) to pass back to the policyholder in the form of interest credits. Still others inflate the amount of hypothetical interest illustrated by charging additional costs to purchase additional options on an equity index that are presumed to result in additional policy earnings, but without reflecting the additional risk that some of the additional options will expire “out-of-the-money,” resulting in a loss—instead of a gain—on the additional options.
Tables 1 and 2 demonstrate that comparing hypothetical premiums, cash values, and death benefits does not necessarily identify the product with the lower costs. As such, hypothetical illustration comparisons are useless as due diligence for product recommendations, and they can expose CFP® professionals to claims of breach of duty to act with care, skill, prudence, and diligence.
The following sections explore various due diligence alternatives to illustration comparisons:
Cost Competitiveness
The pricing and performance of cash value life insurance products is a function of just a few factors: cost of insurance charges (COI); policy expenses (E); and investment gains and/or interest income (i%).
Therefore, premiums are always based on the following formula in minimumpremium, defined-death-benefit policy designs. And policy performance is always based on the following formula in maximum-accumulation, defined-contribution policy designs:
Premiums/performance = COI + E – i%
This simple formula can be used to evaluate the pricing of either proposed coverages and/or in-force policies by first separating policy costs into either cost of insurance charges (COIs), and policy expenses (E), and then grouping expenses by their nature into the only three ways that insurers calculate and collect policy expenses: (1) fixed administration charges (FAEs); (2) cash-value-based “wrap fees” such as M&Es; and (3) premium loads.
Because costs vary from year to year, comparing costs becomes more practical when “normalized” to account for differences in amounts and timing of the different charges in different policies. Normalized values (which are provided by services such as Veralytic, a company founded by one of this article’s co-authors) can then be compared with industry benchmarks for each pricing component.
The practice of benchmarking is well-established in the financial services industry, where a financial product’s performance is compared to a standard, independent point of reference. For example, the performance of a mutual fund is often compared with the Dow Jones Industrial Average, the S&P 500, the NASDAQ, or the Wilshire 5000, depending on the fund’s investment objective. Likewise, comparing COIs and expenses for a given life insurance product to industry standard mortality tables and industry aggregate expense ratios reveals actual cost competitiveness or excessiveness. Comparing costs to benchmarks addresses the requirements of New York’s Regulation 187 and the new CFP Board practice standards.
Cost of insurance charges. Whether disclosed or not, all policy types are priced for expected cost of insurance charges, or COIs. COIs are deductions from permanent life insurance policies to cover anticipated payments by the insurer for death claims. Claims are the largest single cost factor of any insurance policy. With life insurance, COIs typically account for about 85 percent of total costs, and can vary by as much as 80 percent between different insurers and different products—even different products from the same insurer. At the risk of stating the obvious, the higher the COIs, the higher the premiums required to pay higher COIs.
COI charges are calculated year by year on the net at-risk policy death benefit (i.e., the difference between the death benefit less policy account values) multiplied by a COI rate provided by the insurance company for each age corresponding to each policy year for each product. These deductions are much like term life insurance premiums in that they are predominantly for claims paid during a given period (typically one year). For this reason, COIs are frequently referred to as the pure “risk” portion of the premium, reimbursing the insurance company for the risk associated with paying the death benefit, and because the risk of death increases with age, so do the COIs.
In addition, some insurers “load” the COIs to cover other policy expenses not disclosed elsewhere, such as sales loads and other premium-based loads that must be paid (e.g., state premium taxes, federal deferred acquisition costs taxes, and the cost to distribute the policies).
COIs are calculated on the NAR (the net amount at-risk difference between the death benefit less policy account values). Because COIs increase geometrically with age, the NAR is a significant factor in determining COIs. For example, COIs are minimalized when cash values are nearly equal to the policy death benefit, even at older ages when COI rates are at their highest. However, because policy cash values are “collected” by the insurer upon death in addition to COIs collected in prior years, cash values in the policy account on death are also a cost of maintaining the death benefit that must be considered.
Fixed Administration Expenses (FAEs). FAEs are typically charged for expenses related to actuarial design, underwriting and new business processing, and service and administration. They are calculated as some fixed amount set at the time of policy issued either as a flat monthly charge or in relation to the originally issued policy face amount (e.g., $1 per $1,000 of policy face amount). This charge can vary year to year by a predetermined schedule.
FAEs can also include contingent or back-end policy surrender charges that are deducted from the policy cash account value upon surrender or cancellation/termination of the policy. These surrender charges are calculated in relation to the initially issued policy face amount and can be as much as 100 percent or more of the planned annual premium for policy types available to the general public. They can be less than 100 percent, or even 0 percent for policies purchased in larger volumes or fee-only-type products. In either case, this surrender charge typically remains level for an initial period, then reduces to $0 over a following period.
Premium loads. Premium loads are calculated as a percent of premiums paid in a given year and they typically range between 0 percent and 35 percent. Premium-based charges customarily cover state premium taxes that average 2.5 percent, DAC taxes averaging 1.5 percent, and sales loads/expenses ranging between 0 percent and 30 percent. Although state premium taxes and DAC taxes are generally calculated by the respective government agencies as a percent of premium, and insurance companies must pay these taxes, they are not required to assess the charge as a percent of premium. As result, some insurance companies charge no premium loads and collect state and federal taxes from other charges within the policy (usually COIs).
Premium-based charges can also vary depending on the policy year in which a premium is paid, or the level of the premium paid into a given policy. For instance, a higher premium load may be assessed in the early policy years to recover up-front expenses related to underwriting, issue, and distribution of a policy. After these expenses have been amortized (frequently over 10 policy years), premium loads are often reduced to cover the relatively lower policy service and administration expenses.
In addition, a higher premium load may be charged on premiums paid up to a “base policy premium” or “target premium” level, while a lower premium load may be charged on premiums in excess of the base or target amounts. This base/target premium is set by actuaries and generally calculated using conservative assumptions. Therefore, this base/target premium can be thought of as the “insurance premium” to maintain life insurance coverage.
Premium amounts paid in excess of this base/target are typically intended to create a cash value reserve as “pre-payment” of what would otherwise be future premiums, and/or to grow the policy account for wealth accumulation, retirement planning, and/or asset protection. As a result, premiums paid up to the “insurance premium” are typically subjected to higher insurance loads to cover policy expenses unique to the insurance component of the policy, while “excess premiums” are typically subjected to a lower, investment-like loads on those monies contributed toward cash value accumulations.
Cash-value-based “wrap fees.” These are insurance fees charged as a percent of policy account values, similar to fund management fees charged as a percent of assets under management. However, these insurance fees are specific to the policy, separate from and in addition to investment fees, can vary over time and/or the amount of the cash value, and typically range from 0 percent to 1 percent.
Because these fees are specific to each policy—without regard to the underlying general account investment portfolio or mutual-fund-like separate account funds—they need to be considered in any analysis of policy costs. On the other hand, investment fees are specific to the respective separate accounts within a policy, and are a function of the underlying separate account fund selection, which usually changes within the same policy over time with changes in asset allocations of invested assets underlying policy cash values. Investment fees are, therefore, more logically addressed in the evaluation of cash value investment performance.
Reasonableness of Performance Expectations
While past performance is no guarantee of future results, measuring past performance against relevant benchmarks is a generally accepted measure for the reasonableness of performance expectations. The reasonableness of performance expectations is a function of historical performance of cash value investment options appropriate for acceptable risk, the expense ratios for invested assets underlying policy cash values, and the number and diversity of cash value investment options.
Policy account values in traditional products (all forms of universal life, including indexed universal life) are invested in the insurer’s general account managed by the insurer. That general account is required by regulation to invest predominantly in fixed-income securities like high-grade corporate bonds and government-backed mortgages.
Policy account values in variable products are directed by the policy-owner among a family of mutual-fund-like separate accounts typically offering a wide range of asset classes, including domestic and foreign stock funds, domestic and foreign bond funds, a money market account, and usually a fixed account (typically the same as the insurer’s general account).
Also, because neither cash-value-based investment expenses (FMEs), cash-value-based insurance expenses (M&Es), nor life insurance policy earnings are generally illustrated in a standardized manner, be sure to understand the differences between the rate of return shown in illustrations versus the actual rate of return that is reasonable to expect, as follows:
Gross rate. The gross policy interest/earnings rate is that rate of return credited to policy cash values reported before deduction of investment-related fund management expenses (FMEs) and before deduction of cash-value-based insurance expenses. The gross rate is typically disclosed in variable life products but not typically disclosed in traditional universal life or whole life products. The reporting of the gross policy earnings rate is also somewhat unique to life insurance products, as rates of returns for investment products are most often reported net of FMEs.
Net rate. The net policy interest/earnings rate is that rate of return credited to policy cash values reported after deduction of investment-related FMEs, but before deduction of cash-value-based insurance expenses. The net rate is equal to the gross rate minus FMEs, and is most closely analogous to the “investment rate of return” on policy cash values (e.g., universal life policy interest crediting rates and whole life dividend interest crediting rates are generally reported after deduction investment expenses). This net rate is also consistent with mutual funds’ reporting of earnings after deduction of related investment expenses and is therefore most useful in comparing performance outcomes for different life insurance or other financial products.
Net-net rate. The net-net policy interest/earnings rate is that rate of return credited to policy cash values reported after deduction of both investment FMEs and cash-value-based insurance “wrap fees.” The net-net rate is equal to the net rate minus M&Es, and because the net-net rate reflects the rate of return reported on policy cash values after all cash-value-based fees, it can also be referred to as the “policy rate of return.” It is the rate of return at which cash values would otherwise grow but for the deduction of all other policy expenses, COIs, FAEs, and premium loads. As a result, the net-net rate is most useful in accounting for differences in the timing and amount of different charges in different policies for easy comparison.
Additionally, the availability of cash value is an element of suitability specifically mentioned in New York’s Regulation 187. Cash value, or cash surrender value (CSV), is a defining characteristic of permanent life insurance. In simple terms, CSV is the value available to the policyholder for withdrawal or upon policy termination. It is equal to the policy account value minus the surrender charge. All other factors being equal, the higher the accessible cash value after deduction of cost of insurance charges, policy expenses, and contingent surrender charges, the more suitable the policy. Measuring cash value accessibility against benchmark average cash values is useful in determining which products are in the client’s best interest.
Some practitioners may disagree with the use of a consistent net rate when comparing different products and calculating policy expenses. Instead, they may suggest using a consistent gross rate. However, comparing performance based on a consistent gross rate, without knowing and making consistent the cash value asset allocation, can result in understated investment expenses and overstated policy performance. In addition, because the asset allocation typically changes over time (which in turn changes investment expenses), and because separate account funds are frequently added and deleted from a given product (which also changes investment expenses), comparing performance based on a consistent gross rate can produce inconsistent results.
Risk Considerations
Risk is an element of suitability, both generally speaking and specifically as mentioned in New York’s Regulation 187. While the premium is often misconstrued as the price/cost of a life insurance policy, the premium is not the price/cost of the life insurance policy (just like a contribution to an IRA is not the price/cost of the IRA). Rather, the price/cost is the sum of the expenses deducted from the premium/contribution.
If costs are greater than expected or interest/earnings are less than expected, additional premiums will be required to maintain expected benefits, or expected benefits will be reduced or lost, resulting in disappointed clients and a possible complaint. To be suitable over the long term (versus just attractive in sales illustrations): (1) the cost of insurance charges must be adequate to meet the insurer’s expected death benefit claims; (2) policy expenses must be adequate to meet the insurer’s and servicing organization’s service and administration commitments; and (3) expected interest/earnings must be reasonable.
Due diligence for product recommendations should, therefore, consider whether expected cost of insurance charges are consistent with mortality experience, whether expected policy expenses are consistent with operating experience, and whether expected policy interest/earnings are consistent with historical performance of both invested assets underlying policy cash values and corresponding asset class benchmarks. The NAIC Life Insurance Illustrations Model Regulation generally ignores these risks, instead permitting both mortality improvements and operating gains (albeit with disclosures in footnotes not often read by planners or clients), as well as a wide range of interest/earnings assumptions that have too often proven to be unreasonable.
For example, traditional fixed products such as universal life and whole life are required by regulation to invest assets underlying policy cash values predominantly in high-grade corporate bonds and government-backed mortgages. Therefore, the policy interest crediting rate for universal life products, and the dividend interest crediting rate for whole life products, will generally correlate over time with the 5 percent historical rate of return on high-grade corporate bonds and government-backed mortgages (higher for insurers with superior investment performance and perhaps for indexed products, and lower for insurers with inferior investment performance).
However, the NAIC regulations permitted illustrations to assume interest crediting rates as high as 14 percent and required illustrations to reflect assumed interest crediting rates as low as 3 percent. The NAIC regulations continue to allow illustrations to reflect assumed interest crediting rates that vary significantly from the rate of return reasonable to expect, based on historical returns for invested assets underlying policy cash values. Because these assumed rates are generally guaranteed for one year or less, and because insurers routinely change declared interest rates, proper due diligence requires looking beneath the current policy crediting rate to consider both historical performance of both invested assets underlying policy cash values and corresponding asset class benchmarks.
NAIC regulations allow for an even wider range of earnings assumptions for variable products such as variable universal life and variable life. In addition, performance expectations for variable products are not typically set by the insurer, but rather by the agent/broker, and too often they are not correlated with the actual rates of return for the asset allocation appropriate to the risk profile of the client. Again, proper due diligence requires considering the rate of return that’s reasonable to expect from the asset allocation appropriate to acceptable risk.
Conclusion
The New York Regulation 187 provides useful guidance for serving the best interests of the client under CFP Board’s new Code of Ethics and Standards of Conduct, prohibiting illustration comparisons as due diligence for product recommendation, and instead requiring product recommendations be based on a careful, skilled, prudent, and diligent evaluation of costs, performance, and risks relative to benefits.
After all, illustration comparisons that obfuscate costs, performance, and risk, and provide consumers with misleading, fundamentally inappropriate, and unreliable product information cannot be defended as being in the client’s best interests. Rather than relying on illustration comparisons, consider the due diligence alternatives discussed here when considering life insurance products for your clients.
Endnotes
- See FINRA Rule 2210(d) and IM22102(c); the Society of Actuaries “Final Report of the Task Force for Research on Life Insurance Sales Illustrations;” and the Office of the Comptroller of the Currency’s Handbook for Unique and Hard-to-Value Assets.
- See “Reaction to New York’s Best Interest Rule Reveals Industry Fissures,” in Life Annuity Specialist, posted June 2018. Available at lifeannuityspecialist.com.
- See “These 6 States Have Pursued Fiduciary Rules,” by Diana Britton, posted Oct. 23, 2018 at wealthmanagement.com/regulation-compliance/these-six-states-have-pursued-fiduciary-rules; and the California Department of Insurance comment letter to the NAIC Suitability in Annuity Transactions Model Regulation #275 at content.naic.org/sites/default/files/inline-files/cmte_a_aswg_related_0219_cdi_comments.pdf.
- Access the full text of the New York regulation at dfs.ny.gov/docs/insurance/r_finala/2018/rf187a1txt.pdf.
- § 224.4 (b)(1) (dfs.ny.gov/docs/insurance/r_finala/2018/rf187a1txt.pdf).
- Access the full text of the NAIC regulation at content.naic.org/sites/default/files/inline-files/committees_lhatf_582_0.pdf.
- Access “Actuarial Guideline XLIX” at naic.org/documents/committees_a_latf_iul_illustration_sg_related_actuarial_guideline_xlix.docx.
Sidebar: History of Illustration Comparison
The practice of comparing hypothetical illustrations as due diligence for product recommendations began innocently enough. The 1980s brought a variety of new products, and illustrations were the only source of information for trying to understand costs, features, and benefits. However, comparing universal life products to whole life products using illustrations based on dramatically different assumed crediting rates (even though both products are required by regulation to invest underlying cash values in the same asset classes) is now the subject of critical press (for example, see the Sept. 19, 2018 Wall Street Journal article, “Universal Life Insurance, a 1980s Sensation, Has Backfired,” by Leslie Scism at wsj.com.)
Questionable illustrations comparisons continued in the 1990s. Variable life hypothetical values were calculated using assumed earnings rates that were hundreds of basis points higher than the universal and whole life products, and without any consideration of the inherent volatility of equity returns and the corresponding impact on hypothetical policy values.
Ironically, the insurers of the products shown in Tables 1 and 2 of this article had resisted misleading illustration practices for years but were at a competitive disadvantage to those insurers less inclined to follow the spirit of the NAIC regulations. In an environment where prudence is punished and recklessness is rewarded, even otherwise responsible insurers “game the rules” under the NAIC Life Insurance Illustrations Model Regulation to better compete in the illustration comparison contest.
While the NAIC regulation was well-meaning, most other segments of the financial services industry have evolved beyond using hypothetical product comparisons as due diligence for product recommendations. New York’s Regulation 187 provides useful guidance for alternatives to hypothetical illustration comparisons as decision-support for life insurance product recommendations under the new CFP Board practice standards.
—P. A., R. F., and B. F.