Journal of Financial Planning: April 2017
Jack C. DeJong Jr., Ph.D., CFA, is an associate finance professor at the H. Wayne Huizenga College of Business and Entrepreneurship at Nova Southeastern University in Florida. He earned his doctor of philosophy in international management from the University of Hawaii with a specialization in Asian finance. He earned his MBA in finance from the University of Chicago. He is also a co-founder of retirement software maker, Nest Egg Guru.
John H. Robinson is the founder and owner of Financial Planning Hawaii and a co-founder of Nest Egg Guru. He has been in the financial services industry since 1989 and has published numerous papers in peer-reviewed academic and professional journals. Papers he co-authored on retirement income sustainability have won the CFP Board and International Foundation for Retirement Education (InFRE) outstanding paper awards.
Editor’s note: This research was originally presented at the 2016 FPA Annual Conference in Baltimore as unpublished research, where it received feedback from academics and practitioners in attendance. To submit research to be presented at this year’s FPA Annual Conference, visit FPA-BE.org/Academics.
Executive Summary
- Despite the prodigious amount of research on retirement income sustainability, an imperfect understanding of the factors that may increase or decrease the likelihood of retirement nest egg depletion or passing on remaining balances to heirs remains.
- This paper seeks to move the financial planning profession forward by examining six factors known to have a significant impact on sustainability: (1) time horizon; (2) interest rates; (3) fees and expenses; (4) asset allocation; (5) inflation; and (6) withdrawal strategy.
- Bootstrapping simulation techniques provided the basis for the analysis, and the results serve to clarify and quantify the relative impact of each of the six factors.
- The findings suggest a greater awareness is needed of the impact of low interest rates and of the importance of the client’s choice of withdrawal strategy in determining sustainability.
In 1986, Financial Analysts Journal published a paper that would have a profound impact on the financial planning community’s views on portfolio construction. The paper, “Determinants of Portfolio Performance,” (Brinson, Hood, and Beebower 1986) examined various factors that influence the magnitude and variability of portfolio returns, including market timing, security selection, and asset allocation, and the authors concluded that asset allocation, by far, had the greatest impact on both the magnitude and variability of portfolio returns. Although the paper’s findings were challenged at first, subsequent research has generally supported the notion that asset allocation policy plays a critical role in determining both portfolio returns and variability of returns (Davis, Kinniry, and Sheay 2007; Ibbotson and Kaplan 2000).
Bengen (1994) was another influential paper in which the author applied temporal order analysis to a basic retirement withdrawal scenario. Bengen’s results served to raise awareness of the impact that sequence of returns risk (the threat posed by severe down markets early in retirement) and longevity risk may have on portfolio sustainability.
The contributions of these two seminal works in terms of expanding the knowledge base of financial planners cannot be understated. Both spawned a prodigious amount of subsequent research that continues to advance the profession today. At the same time, however, the introduction of unambiguous findings naturally lends itself to misapplication and/or heuristic behavior at the grassroots planner level. For instance, Bengen’s original finding that inflation-adjusted withdrawal rates exceeding 4 percent might not be sustainable for balanced two-asset portfolios over a 35-year time horizon was eagerly adopted—and arguably in some cases misapplied—by legions of financial planners. Although subsequent research has largely discredited the “4 percent rule” (Blanchett and Blanchett 2008; Scott, Sharpe, and Watson 2009; Pfau 2010; Finke, Pfau, and Blanchett 2013), its widespread use as a planning mantra persists nonetheless.
Similarly, while Brinson, Hood, and Beebower (1986) demonstrated the importance of asset allocation in determining portfolio performance, the fact that the original research was not applied to spending portfolios does not appear to have prevented the planning community from asserting its dominant role in determining retirement nest egg sustainability.
Another more subtle example of the influence of heuristics in retirement income planning may be found in the application of portfolio rebalancing. Bengen (1994) assumed that withdrawals from the hypothetical portfolio were made proportionally from stocks and bonds each year and that the portfolio was rebalanced to maintain a constant allocation over time. Subsequent researchers mimicked this design and, as a result, this withdrawal methodology was also incorporated into the universe of retirement simulation apps that are employed by financial planners to guide their clients’ decisions. Although the implicit assumption that proportional withdrawals paired with rebalancing is an efficient withdrawal strategy has been challenged by a number of published journal papers over the past decade (e.g., Spitzer and Singh 2007; Liu, Chang, DeJong, and Robinson 2009; Pfau and Kitces 2013), its application in retirement planning analysis widely persists.
The bottom line is: despite nearly three decades of research, planning practitioners still have a decidedly imperfect understanding of the relative influence of the various factors that determine retirement income sustainability. This paper seeks to isolate and quantify the impact that time horizon, interest rates, inflation, asset allocation, investment expenses, and withdrawal strategy have on portfolio sustainability. The results are designed to better enable planners to show their clients how changing factors that are within their control may impact their financial security.
Literature Review
As noted, one of the most influential research publications for the financial planning community was Brinson, Hood, and Beebower (1986), which considered three basic asset classes (stocks, bonds, and cash), along with the follow-up work by Brinson, Singer, and Beebower (1991), which concluded that broad asset allocation accounts for more than 92 percent of portfolio performance. Although the magnitude of this finding was challenged in subsequent papers (e.g., Jahnke 1997; and Ibbotson and Kaplan 2000), asset allocation is still commonly regarded by practitioners and researchers alike as a critical determinant of portfolio performance and variability (Larrabee 2012). These studies, however, only considered the impact of asset allocation on accumulation portfolios.
Bengen (1994) was among the first to address the dynamics of planning in retirement spending portfolios. In addition to raising awareness of the threat posed to retirees by sequence of returns risk, Bengen also introduced the concept of the safe withdrawal rate—the maximum percentage a retiree might withdraw from a portfolio on an inflation-adjusted basis over a specified time frame with no risk of depletion (i.e., the ability to withstand even the most severe investment conditions). Specifically, Bengen applied historical back-testing and concluded that an inflation-adjusted withdrawal rate of 4 percent should be sustainable over a 35-year time horizon using a two-asset model with no accounting for internal expenses. Following in the footsteps of Brinson, Hood, and Beebower (1986), Bengen also emphasized the importance of asset allocation, and concluded that the optimal allocation for a withdrawal portfolio was likely a stock bond ratio between 50/50 and 70/30.
Bengen (1994) spawned a torrent of retirement income sustainability research. Subsequent researchers, including Kitces (2008); and Finke, Pfau, and Williams (2012), have challenged the premise of the safe withdrawal rate by pointing out that planning real-world retirement spending based off of low-probability down market extremes is likely sub-optimal, as it may cause the retiree to underspend throughout retirement and have a high probability of large remaining balances in retirement.
Other researchers have sought to expand upon the safe withdrawal rate concept by considering various dynamic withdrawal strategies. Among the pioneers in this research line were Guyton (2004) and Guyton and Klinger (2006) who demonstrated that the application of simple decision rules in the withdrawal phase could significantly enhance sustainability. In essence, Guyton’s guardrail strategies were aimed at helping investors sidestep sequence risk without reducing annual withdrawal amounts.
Other researchers have followed this vein further by devising more complex decision-based withdrawal strategies, including strategies that may lead to higher total lifetime withdrawals if the retiree is willing to make annual adjustments to income up or down based upon various investment conditions. Examples include Blanchett, Kowara, and Chen (2012) who found that “spending regimes that dynamically adjust for changes in both market and mortality uncertainties outperform the more traditional approaches” (page 7), and Frank and Brayman (2016) who introduced a “Continually Adjusting Stochastic Actuarial Model,” or “CASAM.”
Another influential research contribution regarding the importance of withdrawal strategy was Spitzer and Singh (2007) who challenged the implicit assumption in Bengen’s analysis that rebalancing is efficient during decumulation. Spitzer and Singh found that a withdrawal strategy that spent down the bond portion of a portfolio first was superior to portfolios that maintained a constant allocation with rebalancing throughout retirement. This is significant because most retirement software today still employs constant allocation with rebalancing as part the simulation methodology. Spitzer and Singh’s analysis found support in Pfau and Kitces (2013), who illustrated how to reduce retirement risk with a rising equity glide path. Spitzer and Singh was also noteworthy in that it incorporated remaining portfolio balance data into its results, which served to quantify their findings beyond mere probabilities and percentages.
Research has also explored the impact of investment expenses, including Pye (2001) and Kitces (2010). Blanchett (2007), and Liu, Chang, DeJong, and Robinson (2009) explored the impact of time horizon. Kizer (2005), Ervin, Filer, and Smolira (2005), and Liu, Chang, DeJong, and Robinson (2009) explored the impact of asset class on sustainability. And more recently, Finke, Pfau, and Blanchett (2013) considered the impact of historically low interest rates and below-average capital market returns on retirement sustainability.
In sum, a wide body of retirement income research has been produced over the past quarter century, and the impact of the six variables considered in this paper have all been considered individually before. The results in this paper are consistent with, and support, the findings of the afore-referenced works. However, this paper adds to the body of knowledge in that it begins to consider the relative impact of each of the six variables on sustainability. It also seeks to help practitioners tangibly quantify shortfall risk by incorporating remaining balance data into the results reporting for each variable.
Methodology
Data source and sample characteristics. The sample period was from January 1970 (which corresponds to the inception of the MSCI EAFE Index) to December 2013, representing 44 years or 528 months of data. This paper used monthly total return data on the S&P 500 Index, the Russell 2000 Index, and the MSCI EAFE Index as available from the Center for Research in Security Prices (CRSP) and Thompson Reuters Datastream. Because the Russell 2000 Index was not established until 1978, this paper follows Liu, Chang, DeJong, and Robinson (2009) in using total return data for the bottom quintile of market cap stocks in the NYSE Index to proxy for the Russell 2000 Index returns for 1970–1978.
The sample portfolios were comprised of four asset classes: (1) the S&P 500 Index; (2) the Russell 2000 Index; (3) the MSCI EAFE Index; and (4) intermediate-term bonds. The equity component for the benchmark model consisted of 45 percent S&P 500 Index, 30 percent Russell 2000 Index, and 25 percent MSCI EAFE Index.
Intermediate bond index returns were not employed as the proxy for bond returns, because the mean bond returns over virtually any historical period in the U.S. are far higher than the rates investors can reasonably expect to earn today. Generating simulations from historical return data runs the risk of producing overly optimistic results. This paper assumed a constant, realistic interest rate similar to what an investor might reasonably expect to earn by investing in (and holding to maturity) a CD or bond today.1
Consistent with prior research on retirement income sustainability (e.g., Spitzer and Singh 2007; Finke, Pfau and Blanchett 2013; and Frank and Brayman 2016), the impact of taxes was not incorporated into this analysis (therefore, all results are gross before taxes). However, it is acknowledged that taxes and, specifically, account/asset type spending order, is another important factor in determining sustainability. This topic is addressed in the sidebar.
Variables. The models considered initial withdrawal rates of 3 percent, 4 percent, 5 percent, and 6 percent; retirement time horizons of 10, 20, 30, and 40 years; rates of returns on bonds of 0 percent, 2 percent, 4 percent, and 6 percent; asset allocations of 100 percent, 80 percent, 60 percent, 40 percent, and 20 percent stocks with the remainder invested in bonds; inflation rates of 0 percent, 1 percent, 2 percent, 3 percent, and 4 percent; and investment expense ratios of 0 percent, 1 percent, 2 percent, and 3 percent.
Four withdrawal strategies were considered: (1) spending stocks first; (2) constant stock/bond allocation with annual rebalancing; (3) a guardrail strategy that did not withdraw from stocks following down years; and (4) spending bonds first.
The basic model design applied in this analysis begins with an initial $1 million retirement nest egg. The sample portfolios were comprised of four asset classes, including large-cap stocks, small/mid-cap stocks, foreign stocks, and intermediate-term bonds. The proxies for the equity asset classes were monthly return data from 1970–2013 for the S&P 500 Index, the Russell 2000 Index, and the MSCI EAFE Index.
Analysis. Bootstrapping techniques were applied to generate 5,000 simulations per illustration. Each bootstrapping iteration drew a random sample with replacement from the 528 months of data, relying on the empirical distribution of historical data. The underlying methodology employed in this analysis is common in academic research (e.g., Spitzer and Singh 2007; Blanchett 2007; and Liu, Chang, DeJong, and Robinson 2009). The simulation results in this report were produced using Nest Egg Guru’s retirement spending application, and may be replicated using statistical software, such as MATLAB (mathworks.com).2
This methodology was chosen over more commonly applied Monte Carlo simulation techniques because resampling of historical monthly return data may lead to more consistency in results reporting, since results are not dependent upon user assumptions regarding expected return and volatility for each asset class. This lack of consistency in Monte Carlo simulation software has previously been acknowledged in the professional literature (e.g., Milevsky and Abaimova 2006; Blanchett and Pfau 2014; and Collins, Lam, and Stampfli 2016). An additional limitation of using popular Monte Carlo simulation software for this particular analysis was that virtually all such commercial applications explicitly assume constant allocation with rebalancing in their results reporting, making it impossible to test the impact of different withdrawal strategies in retirement.
Simulation Scenarios and Results
Table 1 presents the remaining balances for the bottom 1 percent, 5 percent, and 10 percent of the 5,000 simulations for each of the four initial withdrawal rates tested, which are designated as Value at Risk, or VaR, risk measures.
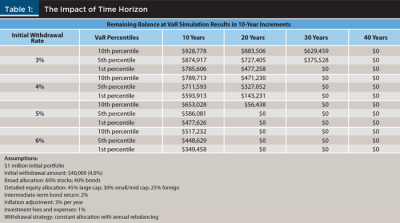
Perhaps the most obvious observation from this data is that the results are far different and far less robust than the results from Bengen’s 1994 back-testing simulations. Not only did the 4 percent inflation-adjusted rate fail to last even 30 years, even the 3 percent withdrawal rate failed at the 99 percent VaR confidence level.
Although these results may be troubling to proponents of the 4 percent rule, they are generally consistent with the findings presented in Finke, Pfau, and Blanchett (2013). Bengen’s 1994 results likely reflect the fact that mean bond returns over the rolling periods used in his analysis were considerably higher than investors can realistically expect to earn today. As Finke, Pfau, and Blanchett (2013) proclaimed: “…the demonstrated success of the 4 percent rule is partly an anomaly of U.S. market returns during the 20th century” (page 54).
The fact that withdrawal rates as high as 6 percent (see Table 1) may be safe for shorter periods suggests that advisers should be careful to consider life expectancy when assisting clients in making withdrawal decisions.
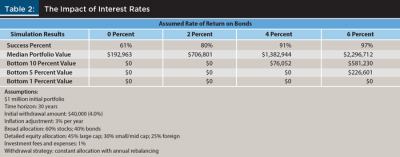
The output presented in Table 2 echoes and serves to further quantify the conclusions from Table 1 regarding the impact that low interest rates have on both portfolio sustainability and remaining balances. With mean bond returns over the period illustrated by Bengen hovering in the 5 percent to 6 percent range, the median remaining balances presented in Table 2 dramatically illustrate the impact that lower interest rates may have on investors today.
The output presented in Table 3 appears to be at odds with prior published research suggesting that optimal retiree portfolio balances should contain a sizeable allocation to bonds. Bengen (1994), for instance, concluded that the optimal allocation for a retiree with a 35-year time horizon was likely somewhere between a 50/50 and 70/30 stock/bond ratio. As with the previous two tables, Table 3 also illustrates the profound impact declining low interest rates have on sustainability, and suggests that the accepted optimal allocation paradigm may merit a shift to more equity-laden allocations. Simply put, sequence risk in bonds appears to be trumping sequence risk in stocks.
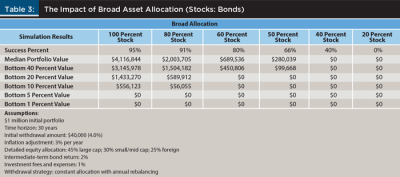
One particularly uneasy conclusion that may be gleaned from the results presented in Table 3 is that they seem to make a case for a 100 percent equity allocation for a 30-year time horizon, because remaining balance data appears to be higher for all simulation results than any bond-weighted portfolio. Aside from the fact that such allocations would be at odds with a large quantity of behavioral finance research documenting investor aversion to short-term stock market volatility (Benartzi and Thaler 1995, 2007; Lei and Yao 2015), it should also be noted that the stilted results may contain an implicit equity bias. Specifically, while the bootstrapping simulations used to produce these results covered a sufficient time period and sample size to produce a broad range of results, there was an unstated, implicit assumption that equity returns would be at least roughly similar to what they have been in the past.
This analysis employed random sampling of monthly equity returns covering the 44-year period from 1970 to 2013. Although this time period effectively encompasses the modern era of the stock market, it is entirely possible that mean equity returns over the next 44 years may not be as robust as they have been in the past. As such, there is reticence to suggest that the output in Table 3 represents an endorsement of significantly higher retiree equity allocations, and alternatively, more comfort in concluding that prolonged periods of low interest rates may have a significant impact on portfolio sustainability.
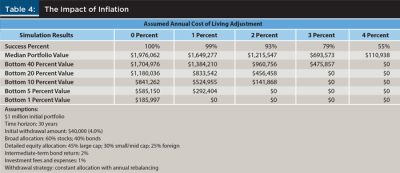
The results presented in Table 4 show that annual cost of living adjustments of 1 percent to 2 percent per year appear to have only a nominal impact on sustainability, though the effects of compounding over a period as long as 30 years can be expected to have a fairly significant impact on remaining balances. Interestingly, Table 4 illustrates the exponential depletionary impact that automated COLAs exceeding 2 percent may have on retirement portfolios.
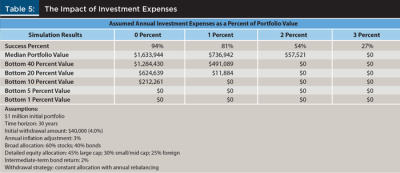
A common oversight in some retirement planning software is the failure to properly account for all internal and external fees and expenses. These costs include both internal investment management and operational expenses and fees paid to the investment adviser or financial planner. Table 5 quantifies the impact that expenses have on long-term sustainability. Although 0 percent expenses are not attainable, Table 5 does drive home the merits of keeping expenses low. Particularly striking is the dramatic increase in the failure rate and decrease in remaining balances as expenses move from 1 percent to 2 percent. To the extent that combined internal management and individual investment advisory fees regularly touch 2 percent or more, this data may give cause for concern to investors in the withdrawal phase of their life cycles.
The results in Table 6 serve to highlight the importance of withdrawal strategy in determining portfolio sustainability. In particular, Table 6 strongly suggests that the widely held consumer belief that retiree portfolios should get more conservative (i.e., bond-weighted) over time may be naïve, and that following such an approach may be detrimental to both wealth and the prospects for sustainability.
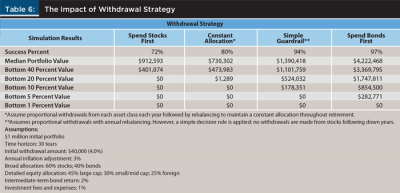
Equally noteworthy is the observation that constant allocation with annual rebalancing leads to significantly worse outcomes than the simple guardrail strategy that was presented as well as the bonds-first strategy. The importance of this finding should not be understated, because a widespread perception in the financial planning community—and a common assumption in professional financial planning software—is that constant allocation with rebalancing is an optimal and desirable withdrawal strategy.
The findings in Table 6 are consistent with Spitzer and Singh (2007), in which the authors concluded: “While the wisdom of rebalancing in the accumulation phase of the life cycle is widely accepted, the wisdom does not appear to extend to the withdrawal phase” (page 55). “Rebalance is shown to be the least effective harvesting method and bonds first the best for maximizing PIBR [remaining balance]” (page 56).
A similar conclusion was reached by Pfau and Kitces (2013): “Results show, surprisingly, that rising equity glide paths in retirement—where the portfolio starts out conservative and becomes more aggressive through the retirement time horizon—have the potential to actually reduce both the probability of failure and the magnitude of failure for client portfolios” (page 38).
Conclusion
This paper examined six factors that impact retirement portfolio sustainability. The results from this analysis are intended to help financial planning practitioners better understand and quantify the relative impact these six factors may have on their clients’ real-world withdrawal decisions. These findings also serve to challenge certain long-held, but sometimes misguided, planning “rules of thumb” and help usher in planning concepts that have been empirically established over the past decade, but which have been slow to be adopted at the practitioner level.
In particular, the results help dispel the notion that a safe withdrawal rate exists for any time period. As Tables 2 through 6 illustrate, changing any of the assumptions in the model will produce results that may be more or less favorable than those presented in Table 1. Simply put, there is no “X percent rule.”
Among the most important concepts that should receive greater attention from the financial planning community is the degree to which declining interest rates have altered the retirement planning paradigm. Practitioners today should be keenly aware that sequence risk from bonds may be as threatening to retirement security as sequence risk from equities. Similarly, this paper suggested that previous research indicating bond-heavy allocations may have been rendered obsolete by the current yield environment, especially if the findings from these research papers were based upon dated mean bond return data.
Consistent with prior research, this study found that the influence of the retirees’ choice of withdrawal strategy is one of the most underappreciated pieces of the retirement income sustainability puzzle. Although declining interest rates have been shown to dramatically reduce portfolio sustainability, the impact of this condition may be ameliorated to a degree by moving away from the widely adopted constant allocation with annual rebalancing withdrawal strategy, and perhaps even more so by abandoning stocks-first withdrawals in retirement.
The four withdrawal methodologies illustrated in this paper were merely intended to raise awareness of the importance that the choice of withdrawal strategy has in determining how long a given retirement nest egg may last. As the literature review showed, considerable research has been devoted to developing complex dynamic distribution strategies that may enhance sustainability far beyond those illustrated here. The strategies illustrated in this paper offer examples that are easily implemented by practitioners and that may represent an improvement over prior planning guidance.
This paper sought to bring prior research findings closer to the practitioner by quantifying the relative impact of six factors that affect retirement portfolio sustainability. However, further study is needed to better understand how these variables interact with and influence each other. A logical extension of this paper would be to apply regression analysis.
Endnotes
- Some readers may challenge the decision to employ a constant fixed return for the bond proxy. It can be argued that assuming interest rates remain near historic lows indefinitely artificially biases the results downward. However, the interest rate assumptions made in this paper reflect the current rate environment for millions of retirees who invest in CDs and bonds, and suggest there is little indication at this time that rates may rise dramatically over the next several years. This position is generally bolstered by guidance from Finke, Pfau, and Blanchett (2013) who note: “Current bond yields are at historical lows, and the R-squared between current and five-year and 10-year bond yields is about 0.90. Research shows returns during the first 10 years of retirement have an inordinately large impact on failure rates” (page 53).
- The original program that was used to create Nest Egg Guru’s retirement software was written in MATLAB. Other statistical software can be used to replicate similar results using the same assumptions and publicly available data.
References
Benartzi, Shlomo, and Richard H. Thaler. 1995. “Myopic Loss Aversion and the Equity Premium Puzzle.” Quarterly Journal of Economics 110 (1): 73–92.
Benartzi, Shlomo, and Richard H. Thaler. 2007. “Hueristics and Biases in Retirement Savings Behavior.” The Journal of Economic Perspectives 21 (3): 81–104.
Bengen, William P. 1994. “Determining Withdrawal Rates Using Historical Data.” Journal of Financial Planning 7 (4): 171–180.
Blanchett, David. 2007. “Dynamic Allocation Strategies for Distribution Portfolios: Determining the Optimal Distribution Glide Path.” Journal of Financial Planning 20 (12): 68–81.
Blanchett, David, and Brian Blanchett. 2008. “Data Dependence and Sustainable Real Withdrawal Rates.” Journal of Financial Planning 21 (9): 70–85.
Blanchett, David, Maciej Kowara, and Peng Chen. 2012. “Optimal Withdrawal Strategy for Retirement-Income Portfolios.” Retirement Management Journal 2 (3): 7–20.
Blanchett, David and Wade Pfau. 2014. “The Power and Limitations of Monte Carlo Simulations.” Adviser Perspectives posted August 26, 2014.
Brinson, Gary P., L. Randolph Hood, and Gilbert L. Beebower. 1986. “Determinants of Portfolio Performance.” Financial Analysts Journal 42 (4): 39–44.
Brinson, Gary P., Brian D. Singer, and Gilbert L. Beebower. 1991. “Determinants of Portfolio Performance II: An Update.” Financial Analysts Journal 47 (3): 40–48.
Collins, Patrick J., Huy D. Lam, and Josh Stampfli. 2016. “How Risky Is Your Retirement Income Risk Model?” Financial Services Review (forthcoming); currently available on SSRN.
Davis, Joseph H., Francis M. Kinniry, Jr., and Glenn Sheay. 2007. “The Asset Allocation Debate: Provocative Questions, Enduring Realities.” Vanguard Investment Counseling and Research. Available at vanguard.com/pdf/icradd.pdf.
Ervin, Danny M., Larry H. Filer, Joseph C. Smolira. 2005. “International Diversification and Retirement Withdrawals.” American Journal of Business 20 (1): 55–62.
Finke, Michael, Wade Pfau, and Duncan Williams. 2012. “Spending Flexibility and Safe Withdrawal Rates.” Journal of Financial Planning 25 (3): 44–55.
Finke, Michael, Wade Pfau, and David Blanchett. 2013. “The 4 Percent Rule Is Not Safe in a Low-Yield World.” Journal of Financial Planning 26 (6): 46–55.
Frank, Larry R. and Shawn Brayman. 2016. “Combining Stochastic Simulations and Actuarial Withdrawals into One Model.” Journal of Financial Planning 29 (11): 44–53.
Guyton, Jonathan T. 2004. “Decision Rules and Portfolio Management for Retirees, Is the ‘Safe’ Initial Withdrawal Rate Too Safe?” Journal of Financial Planning 17 (10): 54–62.
Guyton, Jonathan T. and William J. Klinger. 2006. “Decision Rules and Maximum Initial Withdrawal Rates.” Journal of Financial Planning 19 (3): 48–58.
Ibbotson, Roger P. and Paul D. Kaplan. 2000. “Does Asset Allocation Policy Explain 40, 90, or 100 Percent of Performance?” Financial Analysts Journal 56 (1): 26–33.
Jahnke, William. 1997. “The Asset Allocation Hoax.” Journal of Financial Planning 17 (8): 64–71.
Kitces, Michael. 2008. “Resolving the Paradox—Is the Safe Withdrawal Rate Sometimes Too Safe?” The Kitces Report posted May 2008.
Kitces, Michael. 2010. “Investment Costs, Taxes, and the Safe Withdrawal Rate.” The Kitces Report posted February 2010.
Kizer, Jared. 2005. “Drawing Down and Looking Abroad: International Diversification and Sustainable Withdrawal Rates.” Journal of Indexes May/June 2005.
Larrabee, David. 2012. “Setting the Record Straight on Asset Allocation.” CFA Institute Blog posted February 16, 2012.
Lei, Shan, and Rui Yao. 2015. “Factors Related to Making Investment Mistakes in a Down Market.” Journal of Personal Finance 14 (2): 34–42.
Liu, Qianqiu, Rosita P. Chang, Jack C. DeJong Jr., and John H. Robinson. 2009. “Reality Check: The Implications of Applying Sustainable Withdrawal Rate Analysis to Real World Portfolios.” Financial Services Review 18 (2): 123–139.
Milevsky, Moshe and Anna Abaimova. 2006. “Will the True Monte Carlo Number Please Stand Up?” Journal of Financial Planning Between the Issues online publication, posted July 15, 2006.
Pfau, Wade D. 2010. “An International Perspective on Safe Withdrawal Rates: The Demise of the 4 Percent Rule?” Journal of Financial Planning 23 (12): 123-139.
Pfau, Wade, and Michael Kitces. 2013. “Reducing Retirement Risk with a Rising Equity Glide Path.” Journal of Financial Planning 27 (1): 38–45.
Pye, Gordon. 2001. “Adjusting Withdrawal Rates for Taxes and Expenses.” Journal of Financial Planning 14 (4): 126–136.
Scott, Jason S., William F. Sharpe, and John G. Watson. 2009. “The 4% Rule at What Price?” Journal of Investment Management 7 (3): 31–48.
Spitzer, John, and Sandeep Singh. 2007. “Is Rebalancing a Portfolio During Retirement Necessary?” Journal of Financial Planning 20 (6): 46–57.
Citation
DeJong, Jack C., and John H. Robinson 2017. “Determinants of Retirement Portfolio Sustainability and Their Relative Impacts.” Journal of Financial Planning 30 (4): 54–62.