Journal of Financial Planning: October 2025
August Saibeni began his professional career at one of the Big Eight CPA firms, with emphasis on healthcare clients. He then worked for publicly traded healthcare companies in the Los Angeles area prior to becoming corporate controller for a major Sacramento healthcare system. He then became president and CEO of a surgery center spinoff, which was subsequently sold to a publicly traded healthcare company. After retiring as president and CEO, he served as an adjunct accounting professor for 16 years at a local community college. August has had several articles published in other journals.
This article discusses quarterly rate changes for 30-year fixed rate mortgages and assesses whether historical data currently support a reasonable expectation of waiting to buy a home in hopes of a significant rate reduction. To review historical data, I accessed FRED using the FRED data series, MORTGAGE30US1 along with federal funds rate data.2 After reviewing data back to 1971, it does not seem reasonable to expect 30-year fixed mortgage rates to decline on average more than perhaps 25 to, at most, 50 basis points in any one quarter, especially given the average quarterly 6.8 percent Q2 2025 level of 30-year fixed mortgage rates. Unless a buyer is also using other criteria such as a weak housing market, it does not seem worth the risk of missing out on buying a desired home by waiting for lower 30-year fixed mortgage rates given the current level of 30-year mortgages. A buyer can always refinance if rates move significantly lower in the future.
Economists have long studied what they term “intertemporal choices” (time-related decisions involving present versus future tradeoffs), and they try to understand decision influences such as emotional visceral factors and implied discounted cash flow utility models as first introduced by Paul Samuelson in 1937.3 Buying a home could be an example of an intertemporal choice that causes great decision conflicts given uncertainty related to interest rate and home price volatility. Potential buyers may encounter two conflicting emotions; one is “fear of missing out” and another is fear of overpaying due to interest rate and home price volatility. As discussed by Frederick et al. (2002), anchoring also causes decision choice uncertainty depending upon what may have recently happened. For example, if interest rates have recently declined, a potential buyer may think they should wait for the next rate decrease. Similarly, if home prices have recently escalated, buyers may tend to buy to avoid being priced out of the market.
Today, home buyers may experience the decision-making dilemma described above as recent history shows interest rate drops that resulted in 30-year mortgage rates in the 3.0 percent range. This past history may cause decision uncertainty given that there is political pressure to reduce the federal funds rate, which could lead to reduced fixed mortgage rates. The question however is whether a buyer should have a reasonable expectation of a significant drop in 30-year fixed rate mortgages based upon what may happen to the current federal funds rate. A buyer’s optimism about the effect of a lower federal funds rate on the 30-year fixed mortgage rate may not be realized.
Fed Funds Rate vs. 10-Year Treasury
I looked at 217 quarters of data from Q1 1971 to Q2 2024, which includes 216 change quarters. Using quarterly averages, data show that 30-year mortgage rates have ranged from a high of 17.7 percent during October 1981 to a low of 2.8 percent during October 2020, with the quarterly average rate as of Q2 2025 being about 6.8 percent. During this same period from Q1 1971 to Q2 2024, the federal funds rate ranged from a high of 17.8 percent to a low of 0.06 percent. One reason I focused on the federal funds rate rather than the 10-year Treasury rate is that the federal funds rate is a base for both the 10-year Treasury rate and the 30-year fixed mortgage rate, and I wanted to explore the link between the federal funds rate and 30-year fixed mortgage rates. While the 10-year Treasury rate is often cited as a mechanical benchmark for 30-year fixed mortgage rates, the link between the 10-year Treasury rate and the 30-year fixed mortgage rate, as with the federal funds rate, also exhibits uncertainty.
Since Q3 1971, the average quarterly difference between the 10-year rate and the 30-year mortgage rate has ranged from a low of 0.69 basis points during Q3 1975 and a high of 394 basis points during Q2 1980, with the average difference being 243 basis points as of Q2 2025 due to market conditions. Another important reason to consider the influence of the federal funds rate on 30-year mortgage rates is that home buyers may rely too much on what may happen with the 30-year mortgage rate in anticipation of the Federal Open Market Committee making changes in the federal funds rate.
Analysis of Historical Data
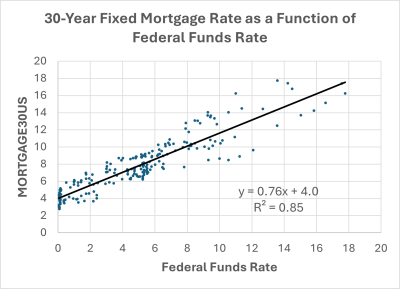
Figure 1 shows the relationship between 30-year fixed mortgage rates and the federal funds rate for the quarterly period from Q1 1971 to Q2 2025. The simple regression line shows the relationship between the federal funds rate and MORTGAGE30US, which indicates that the federal funds rate explained about 85 percent of the 30-year mortgage rate level, meaning that other forces such as economic, social, market, and political factors may have also influenced rates.
First Difference Forecasting Model
To create a more reliable forecasting model, we convert the relationship of levels of federal funds rates and MORTGAGE30US rates as modeled in Figure 1 into change data. We do this by subtracting prior data values from subsequent data values, which is called a “first difference.” The first difference of the federal funds rates and the first difference in MORTGAGE30US rates are modeled in Figure 2. This first difference modification is needed to make sure the variables are stationary. With certain exceptions, time series modeling generally requires that variables be stationary, which requires the mean of data series to be stable. The level values of MORTGAGE30US and the federal funds rate are not stationary as they both exhibit trended data. A trend line does not have a constant mean. The changes in the levels of our variables are stationary since the first difference change data show stable means and generally stable variances. Stationarity of the differenced variables was confirmed through standard tests such as the augmented Dickey-Fuller procedure. Further discussion of stationarity is beyond the scope of this paper. See the Appendix for a brief discussion of Granger causality and whether changes in the federal funds rate Granger cause changes in 30-year mortgage rates.
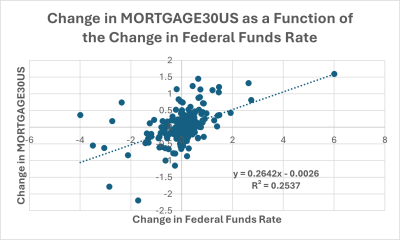
In Figure 2, the low R-squared value of 0.25 should concern the buyer who procrastinates buying a home due to betting on the chance of 30-year mortgage rate drop due to a potential drop in the federal funds rate. Changes in the federal funds rate explain only about 25 percent of the change in long-term mortgage rates, and it looks like only about 26 percent of the federal funds rate change flows through to the change in long-term mortgage rates.
If the federal funds rate dropped by 33 basis points from the current value of about 4.33 percent (as of this writing) to 4.00 percent, we can see from Figure 1 that the lowest 30-year mortgage rate experienced with a 4.0 percent federal funds rate was a bit above 6.0 percent. From the data work sheet (not included), the actual value is 6.2 percent. From the historical record, we need to see federal funds rates at 3.4 percent or below to see 30-year mortgage rates start to decline to the sub 6 percent level.
Using our more accurate forecasting change model in Figure 2, a decline of 33 basis points in the federal funds rate historically resulted in a decrease of about 10 basis points for the 30-year fixed mortgage rate using our current data, so we could on average expect a revised 30-year mortgage rate of about 6.7 percent, down from 6.8 percent. Of course, market conditions can cause changes different from the average change. See the Appendix for a further discussion distinguishing the levels model from the first difference model.
Estimating Likelihood of Mortgage Rates Under 6 Percent
So, what are the chances of upcoming federal funds rate cuts needed to anticipate sub 6 percent 30-year fixed mortgages? Table 1 shows some historical federal funds rate drops given levels of the federal funds rate at the time of the drop. For example, read the grouping at 4.0 percent as the grouping of the federal funds rate between 0 and 4.0 percent
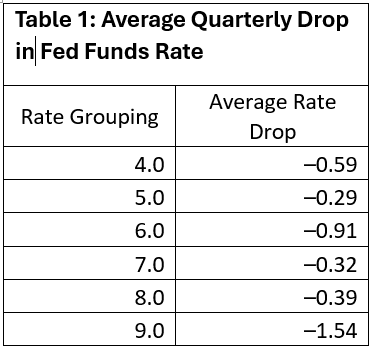
We can see that when the federal funds rate has been between 0 and 4 percent, on average when a federal funds rate drop happens, there has been a drop of 59 basis points. When rates have been above 4 percent but below 5 percent, on average there has been a drop of 29 basis points. If we then have a drop of 29 basis points, the federal funds rate would be around 4.0 percent and on average, as we calculated from Figure 2, a reasonable estimate of 30-year fixed mortgage rates would be about 6.7 percent, which is generally the same as our current rate and agrees with our model from Figure 2. If we experience a drop of 59 federal funds rate basis points, the mortgage rate would be about 6.6 percent as calculated from the model in Figure 2, which again is not much different from the current average quarterly rate as of the end of Q2 2025.
Table 2 looks at another way to help estimate 30-year fixed mortgage rate changes. Table 2 looks at historical mortgage rate categories and then calculates the average drop in quarterly rates looking at only the historical rate groupings.
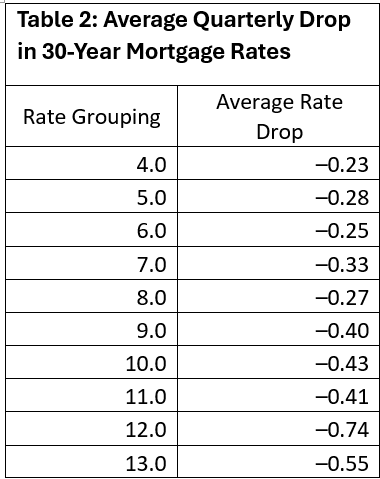
We see using historical data that when 30-year fixed mortgage rates have been in the range of 6 percent to 7 percent and there is a drop in rates, the average drop is only about 25 to 33 basis points for a quarter. This would result in a drop of current rates of 6.8 percent down to about 6.55 percent or 6.47 percent, which on average has been a historically optimistic rate to expect if a drop occurs.
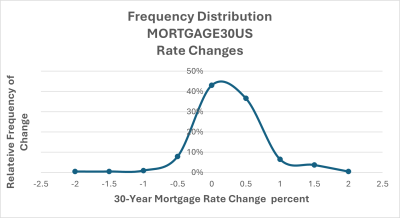
An additional exhibit to show that “large” mortgage rate changes are rare, Figure 3 shows a frequency distribution of 30-year fixed mortgage rate changes. Over the 216 change quarters, the largest rate increase was 159 basis points in October 1980, and the largest decrease was a drop of 219 basis points in October 1982. At the time, 30-year mortgage rates were in the 14 percent range.
While Table 1 considered rate drops based upon when a rate was dropped and where mortgage rates were at the time of the drop, Figure 3 shows the unconditional frequency of rate drops. Notice that even using an unconditional rate drop scheme, most quarterly rate changes are in the non-sensational range of −50 basis points to +50 basis points. Only 13 quarters (nine up and four down) had 100+ basis point changes out of 214 rate change quarters, or 6.1 percent. Two quarters had no change.
Conclusion
Delaying home buying solely in anticipation of a steep drop in the 30-year fixed mortgage rate may not be prudent. Historical data show that quarterly rate declines of 1 percent or more are rare, particularly when rates are near their long-run average as is currently the case. In addition to data summarized above, buyers should know that from Q1 1971 to Q2 2025, the median 30-year fixed mortgage rate was 7.3 percent, approximately 50 basis points above the current rate. Additionally, the trimmed mean, which excludes the top and bottom 20 percent of values, is 7.4 percent but the mode is 8.7 percent, suggesting that the trimmed mean is not smoothly symmetric even when extremes are removed. So, the median, mean, and mode of the trimmed distribution are all above the current rate of 6.8 percent. These measures reinforce the idea that current rates sit below typical historical levels and that expectations for sharp near-term declines may be unrealistic.
As a current reasonableness check, the average quarterly MORTGAGE30US rate for Q2 2025 is shown as 6.79 percent and the average quarterly rate for 2025Q3, as of September 11, 2025, is shown as 6.62 percent. The rate for the week ending on Thursday, September 11, 2025, is shown as 6.35 percent. These rates seem within the range of the rates and rate changes discussed in this article. The goal of this paper was to analyze the relationship of change in the federal funds rate and the change in the 30-year fixed mortgage rate. For a given date, the rate level may be different from this paper’s data sequence ending at Q2 2025, but the rate changes on average for a quarter have a historical expectation to be within the ranges described here. Of course, drastic economic events can happen, which increase or decrease the historical average range for a given period.
Further analysis could explore the influence of inflation expectations and housing demand on 30-year fixed mortgage rates. Both factors interact with monetary policy and credit markets in ways that may complicate forecasts and obscure simple rate change expectations.
Appendix
When analyzing time series data for financial planning insights, it’s crucial to distinguish between simple correlation and actual predictive relationships. Two variables may move together, yet neither may lead the other in time, which limits their value in forecasting models. Sir Clive Granger, who received the Nobel Prize in Economic Sciences in 2003, introduced a method to test whether one variable systematically precedes another and improves its forecast. If it does, it’s said to “Granger cause” the other.
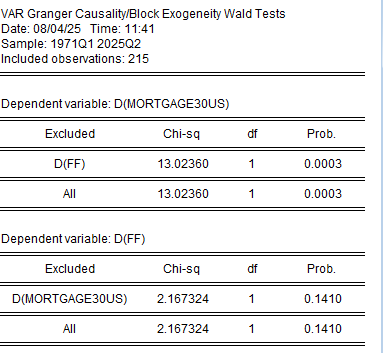
Using a vector autoregressive (VAR) model, I tested whether changes in the federal funds rate can help predict changes in the 30-year fixed mortgage rate. The null hypothesis in each regression asserts that changes, expressed as first differences, D(FF) for the fed funds rate, and D(MORTGAGE30US) for mortgage rates do not affect the dependent variable. When D(MORTGAGE30US) is the dependent variable, I found that D(FF) has a statistically significant effect, allowing rejection of the null hypothesis at a confidence level exceeding 99 percent.
I calculated the full data series to confirm this relationship, and the result is shown below: changes in the fed funds rate Granger cause changes in mortgage rates. However, when I restricted the sample period, the data became sparse, and the causality became statistically inconclusive—emphasizing the importance of robust sample sizes in time series forecasting.
These findings may help financial planners anticipate rate movements more effectively when advising clients on mortgage timing or evaluating refinancing opportunities.
Table A1: Granger Causation for Change in Federal Funds Rate and Change in 30-Year Fixed Mortgage Rates
Levels Regression (Table A1)
- What it shows: A strong long-run relationship between the level of the federal funds rate and the level of the 30-year mortgage rate.
- Interpretation: If the federal funds rate is high, mortgage rates tend to be high too. The regression line (with an R-squared of 0.85) suggests that about 85 percent of mortgage rate levels can be explained by federal funds rate levels.
- Limitation: This doesn’t tell us how mortgage rates will change in response to a change in the federal funds rate.
First Difference Regression (Table A2)
- What it shows: A short-run relationship between changes in the federal funds rate and changes in mortgage rates.
- Interpretation: Only about 25 percent of the change in mortgage rates can be explained by changes in the federal funds rate. The coefficient 0.26 suggests that a 1-point change in the federal funds rate leads to only a 0.26-point change in mortgage rates.
- Why it matters: This model is more appropriate for forecasting short-term movements because it uses stationary data, which is a requirement for most time series models.
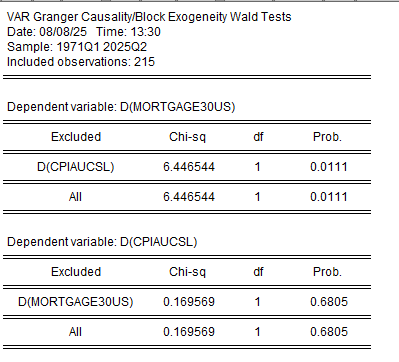
In addition to the federal funds rate, inflation dynamics also demonstrate a predictive relationship with mortgage rates. Using a vector autoregressive (VAR) model, I tested whether changes in the Consumer Price Index (CPI), captured as first differences D(CPIAUCSL), Granger cause changes in the 30-year fixed mortgage rate, represented as D(MORTGAGE30US). The results reveal strong statistical significance: the p-value for this relationship was 0.0111, indicating that inflation changes reliably precede and help forecast movements in mortgage rates.
Notably, the causality does not run in reverse. The test for mortgage rates Granger causing inflation yielded a p-value of 0.6805, well above conventional thresholds for significance. This asymmetry reinforces the role of inflation as a leading indicator—not just a coincident factor—when modeling interest rate trajectories.
Inflation pressures, often discussed in broad macroeconomic terms, appear to directly influence mortgage affordability and refinancing risk. By tracking price-level shifts alongside monetary policy movements, advisers can anticipate client exposure to mortgage rate changes with greater precision.
Table A2: Granger Causation for Change in CPI4 and Change in 30-Year Fixed Mortgage Rates
Endnotes
- Freddie Mac. 2025. “30-Year Fixed Rate Mortgage Average in the United States [MORTGAGE30US].” Retrieved from FRED, Federal Reserve Bank of St. Louis. https://fred.stlouisfed.org/series/MORTGAGE30US.
- Board of Governors of the Federal Reserve System (US). 2025. “Federal Funds Effective Rate [FEDFUNDS].” Retrieved from FRED, Federal Reserve Bank of St. Louis. https://fred.stlouisfed.org/series/FEDFUNDS.
- Frederick, Shane, George Loewenstein, and Ted O'Donoghue. 2002. “Time Discounting and Time Preference: A Critical Review.” Journal of Economic Literature 40 (2): 351–401.
- U.S. Bureau of Labor Statistics. 2025. “Consumer Price Index for All Urban Consumers: All Items in U.S. City Average [CPIAUCSL].” Retrieved from FRED, Federal Reserve Bank of St. Louis. https://fred.stlouisfed.org/series/CPIAUCSL.