Journal of Financial Planning: February 2019
Mark Kantrowitz is publisher and vice president of research for SavingForCollege.com. A leading expert on student financial aid, scholarships, and student loans, he has been widely quoted in national newspapers and magazines about college admissions and financial aid, and has written for the New York Times, Wall Street Journal, Washington Post, and Reuters, among others. He is the author of four bestselling books about scholarships and financial aid, and he serves on the editorial board of the Journal of Student Financial Aid, the editorial advisory board of Bottom Line/Personal, and is a member of the board of trustees of the Center for Excellence in Education.
Student loan debt increases because of the failure of government grants to keep pace with increases in college costs on a per-student, inflation-adjusted basis.
This phenomenon is illustrated by the following chart, which is based on “wave” data published by the State Higher Education Executive Officers Association (SHEEO). State appropriations to public colleges decrease during a recession and for several years afterward, due to decreases in state tax revenues. Although state support subsequently improves, it never fully recovers from the previous cuts. Instead, the cuts are offset by increases in net tuition revenue on a per-student, constant-dollar basis.
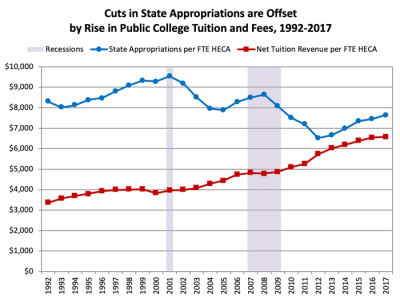
From 1992 to 2017, state appropriations per full-time equivalent (FTE) enrollment decreased by 8 percent in constant dollars, according to the Higher Education Consultants Association (HECA), and net tuition revenue increased by 96 percent, almost doubling. During the same time period, public college enrollment, on a full-time equivalent basis, increased from 8.1 million to 11.0 million, a 36 percent increase. Thus, public colleges are doing more with less.
The maximum federal Pell Grant has also decreased on an inflation-adjusted basis.
The cuts in government support of postsecondary education, on a per-student basis, shift the burden of paying for college from the federal and state governments to families. But, family income has been flat, with median income increasing from $60,062 in 1999 to $60,309 (0.4 percent) in 2016, with a slight uptick to $61,372 in 2017, according to the U.S. Census Bureau.1
The increase in the net price of college, without a concurrent improvement in family ability to pay for college, forces families to focus more on college affordability. Some families shift enrollment from private non-profit colleges to public colleges and from four-year colleges to two-year colleges. Other families respond to the increase in costs by borrowing more, since student loans are the only form of financial aid with any degree of elasticity.
This chart shows how enrollment shifts from more advanced degrees to less advanced degrees according to income. The decline in bachelor’s degree attainment by low-income students can be explained by this shift in enrollment patterns:
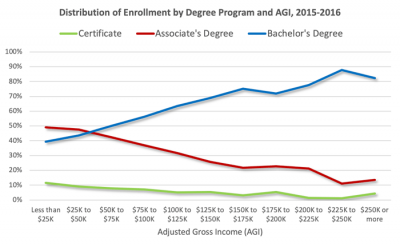
This shift in enrollment patterns by income may explain the improvement in bachelor’s degree attainment rates over the last two decades. The six-year graduation rate at public colleges has increased from 51.7 percent in 1996 to 58.5 percent in 2008, a 6.8 percentage point improvement, compared with an increase from 63.1 percent in 1996 to 65.4 percent in 2008 at private non-profit colleges, a 2.3 percentage point improvement.2
Declines in college affordability have forced low-income students to enroll in less expensive colleges and degree programs, leaving a wealthier mix of students at four-year colleges. Wealthier students are more likely to graduate from college.
College affordability challenges are also manifest in increasing student loan debt. Total outstanding student loan debt has reached several milestones in the past decade. Federal and private student loan debt outstanding exceeded credit card debt in 2010, auto loan debt in 2011, and reached the $1 trillion mark in 2012. Federal and private student loan debt outstanding reached the $1.5 trillion mark in 2018.
Student loan debt is now a macroeconomic factor, albeit a weak one, with annual student loan payments accounting for 0.4 percent of GDP. Student loan debt is only about a sixth of mortgage debt and is unlikely to ever exceed mortgage debt since mortgage debt tends to grow faster than student loan debt.
Increases in total outstanding student loan debt are predictable because the trend line is almost linear, as shown in this chart based on data published by the Federal Reserve Bank of New York (FRBNY) in the quarterly Household Debt and Credit Report. If growth continues at the same rate, total student loan debt outstanding should reach $2.0 trillion by the year 2024.
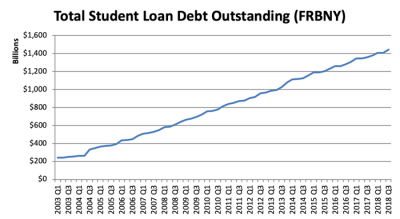
The FRBNY data underreports actual student loan debt outstanding, because the FRBNY data are based on a sampling of Equifax data. The age distribution of the FRBNY Consumer Credit Panel is older than the age distribution of student loan borrowers.
The steady growth in outstanding student loan debt occurs because student loan debt is continually refreshed with a new cohort of borrowers each year. New borrowing exceeds the progress in paying back student loan debt because student loans are repaid over decades, not months to years like credit card debt.
Although milestones draw attention to a problem, the impact on individual students matters more.
This chart shows total undergraduate student loan debt for bachelor’s degree recipients at graduation, including federal and private student loans, but excluding parent education loans. The chart is based on an analysis of data from the National Postsecondary Student Aid Study (NPSAS), a large quadrennial survey with geometric interpolation and projection in between NPSAS years.
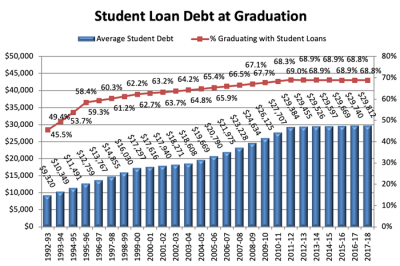
The growth in student loan debt at bachelor’s degree attainment slowed significantly in the 2015–2016 NPSAS, as more student borrowers reached the federal Direct Stafford loan limits. Average student loan debt at graduation for associate’s degree and certificate recipients continues to grow, as does parent education debt, even though federal Direct Stafford loan limits have not increased since 2008.
Most college graduates can afford to repay their student loans. Student loan debt is affordable if the borrower can afford to repay their student loans in a reasonable amount of time (10 years or less), with loan payments that are less than 10 percent of gross income.3 This corresponds to total debt at graduation that is less than the student’s annual income.
If total student loan debt exceeds annual income, the student loan debt is considered excessive. When student loan debt is not in sync with income, the borrower will need an alternate repayment plan, such as extended repayment or income-driven repayment, to afford the monthly loan payments.
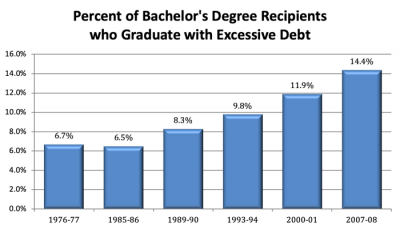
The following chart shows the percentage of bachelor’s degree recipients who have graduated with excessive debt. The recent data is based on the Baccalaureate and Beyond (B&B) Longitudinal Studies. Older data is based on a similar set of studies, the National Survey of Recent College Graduates (RCG). The data shows that the percentage of bachelor’s degree recipients who have graduated with excessive debt has increased in the last three decades. Projecting the trend forward suggests that about one in six bachelor’s degree recipients are now graduating with excessive debt.
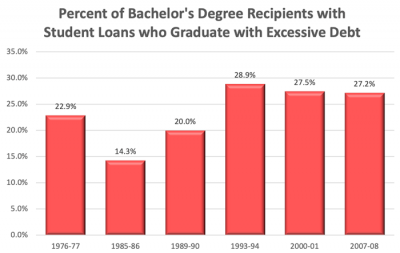
This trend is driven by the growth in the percentage of students who borrow to pay for college, as opposed to an increase in reckless borrowing. Of bachelor’s degree recipients who borrow, this chart shows that slightly more than a quarter have graduated with excessive debt for the last two decades:
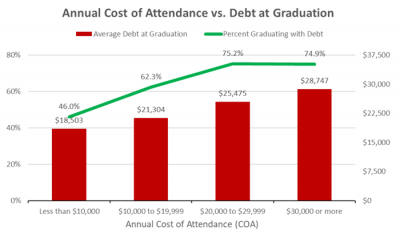
And this chart shows that student loan debt at graduation correlates with college costs. There is about a $3,000 increase in debt at graduation for each $10,000 increase in the annual cost of attendance. The cost of attendance includes tuition and fees, books, supplies and equipment, room and board, transportation and miscellaneous/personal expenses. Students who enroll at higher-cost colleges are also more likely to graduate with student loan debt. So, one way to reduce student loan debt at graduation is to enroll at a lower-cost college.
Despite the growth in student loan debt and excessive debt, most college graduates do not default on their student loans. Borrowers with a high debt-to-income ratio respond by using extended repayment and income-driven repayment to reduce their monthly loan payment by stretching out the term of the loan. The monthly loan payment represents about the same percentage of monthly income as for students who did not borrow excessively.
Increasing the repayment term from 10 years to 30 years cuts the debt-to-income ratio roughly in half. Eventually, the increasing student loan debt will catch up with borrowers, but not for another two to three decades. Until then, borrowers will be able to avoid defaulting on their student loans by choosing extended and income-driven repayment plans.
There is not really a student loan problem, so much as a college completion problem. Students who drop out of college are four times more likely to default on their student loans than students who graduate. They also represent about two-thirds of the defaults.
College affordability is a key driver of both the shift in enrollment patterns to lower-cost colleges and the increasing student loan debt at graduation.
College affordability can be measured using the college affordability index, which is the ratio of the annual net price to total income. Net price is equal to the difference between total college costs and gift aid. Gift aid includes grants, scholarships, tuition waivers, and other government and institutional aid that does not need to be earned through work or repaid. Total income includes both taxable income and untaxed income.
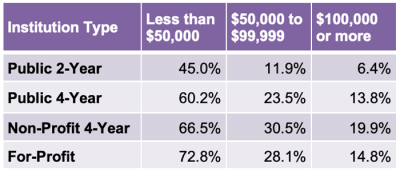
This table shows how the college affordability index changes based on family income and type of college. Everybody struggles to pay for college, but low-income families struggle more than middle-income families, and middle-income families struggle more than high-income families. Notice how a low-income family must pay a greater share of total income to send their child to a community college than a middle-income family pays to send their child to a private non-profit four-year college. This is after grants and scholarships have reduced the cost of attendance.
This chart shows how the total college affordability index changes based on degree level and adjusted gross income (AGI). The total college affordability index multiplies the college affordability index by the normal timeframe for the degree (e.g., four years for a bachelor’s degree).
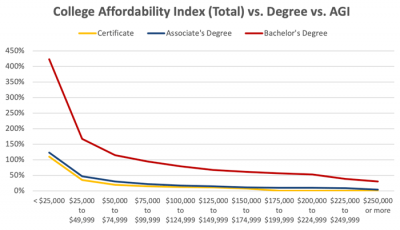
When the total college affordability index exceeds 100 percent (or 25 percent for a single year of the college affordability index), the student may need to borrow excessively in order to cover the college costs. The college affordability index exceeds 100 percent for bachelor’s degree programs, on average, at $75,000 to $99,999 of income. This is why low-income students shift enrollment from bachelor’s degree programs to certificates and associate’s degree programs.
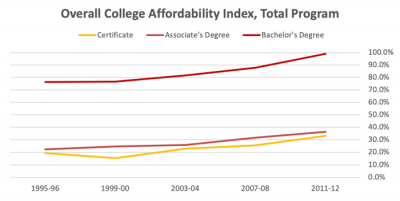
This chart shows how the college affordability index has increased over time, indicating that college is becoming less affordable:
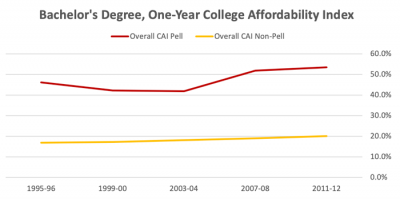
The problem is much worse for federal Pell Grant recipients, as shown in this chart:
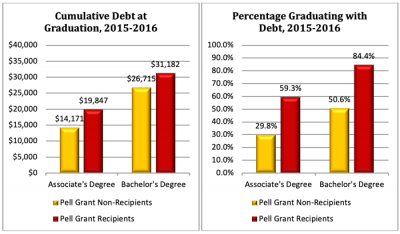
Another indication that college is much less affordable for federal Pell Grant recipients is the amount of debt at graduation. These charts show that federal Pell Grant recipients are much more likely to graduate with student loan debt than middle- and high-income students, and they graduate with more of it than non-recipients. Pell Grant recipients graduate with about $5,000 more student loan debt than non-recipients. Pell Grant recipients who graduate with an associate’s degree are twice as likely to borrow as non-recipients. Pell Grant recipients who graduate with a bachelor’s degree are two-thirds more likely to borrow as non-recipients.
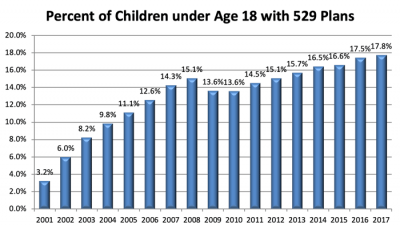
College savings are the antidote to student loan debt. The more families save, the less they will need to borrow. (Saving for college also increases college enrollment and graduation rates, since it establishes an expectation that the child will go to college.)
Although more families are saving for their children’s college educations, not enough families are saving for college. Those that save for college are also not saving enough. This chart shows that 18% percent of children under age 18 have 529 college savings plans:
Endnotes
- Table A-1 of Kayla Fontenot, Jessica Semega and Melissa Kollar, “Income and Poverty in the United States: 2017,” Report Number P60-263, U.S. Census Bureau, September 12, 2018.
- Table 326.10, “Graduation Rate from First Institution Attended for First-Time, Full-Time Bachelor’s Degree-Seeking Students at 4-Year Postsecondary Institutions,” 2016 Digest of Education Statistics.
- Mark Kantrowitz, “Who Graduates with Excessive Student Loan Debt?” from StudentAidPolicy.com, December 14, 2015.
Learn more from Mark Kantrowitz at FPA Retreat 2019, where he will present on this topic.